
IELTS Writing Task 1
A glance at the graph provided reveals some striking similarities between the Chinese and US birth rates during the period from 1920 to 2000.
It is evident that the birth rates of both nations declined over the period of 80 years. Although the two trends were similar in terms of a general drop, the birth rate of the USA in most year was higher than that of China.
In the 1920 - 1935 period, the birth rate in America fluctuated, although it always remained above 10%. However, in the following decade, there was a dramatic dip, followed by a significant increase to exactly 15% in 1950. Since then, it has fallen more gradually, which declined to 7% by the year 2000.
Over the same period, the birth rate in China varied more significantly than in the US. It dropped to 5% from 1940 to 1945 before reaching the highest point of the whole line graph, 20% in 1950. By contrast, 5 years later, the birth rate in China declined rapidly by over 10%, falling to approximately 2% in 2000.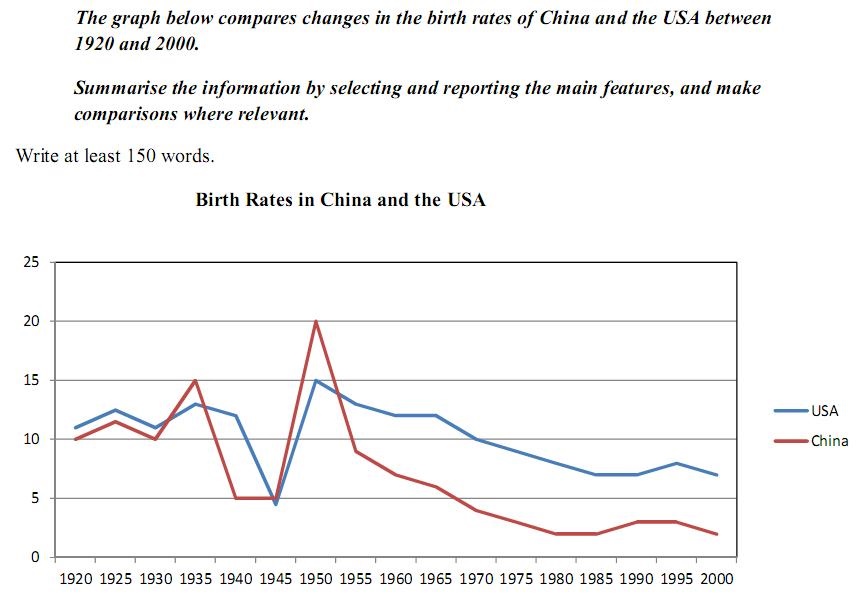
Top answer
I have made some changes to make the text more natural English. The yellow highlights show errors or mistakes. A glance at t T he graph provided reveals some striking similarities between the Chinese and US birth rates during the period from 1920 to 2000.
- I have made some changes to make the text more natural English.
- The yellow highlights show errors or mistakes.
- A glance at t T he graph provided reveals some striking similarities between the Chinese and US birth rates during the period from 1920 to 2000.
- It is evident The first similarity is that birth rates of both nations declined over the 80-year period of 80 years .
- Although the two trends were similar in terms of a general drop, the birth rate of the USA in most year was higher than that of China.
Get the Weekly English Kit 📬
New words, one handy idiom, and a 2-minute quiz — delivered to your inbox to keep your streak alive.
I have made some changes to make the text more natural English. The yellow highlights show errors or mistakes.
A glance at tThe graph provided reveals some striking similarities between the Chinese and US birth rates during the period from 1920 to 2000.
It is evident The first similarity is that birth rates of both nations declined over the 8
 Related Questions