
0
OLZHAS BOLATBEKOV Posted 10 years ago
Grammar
IELTS WRITING TASK 1
And here is the link for bar chart:
please, check my essay and correct mistakes
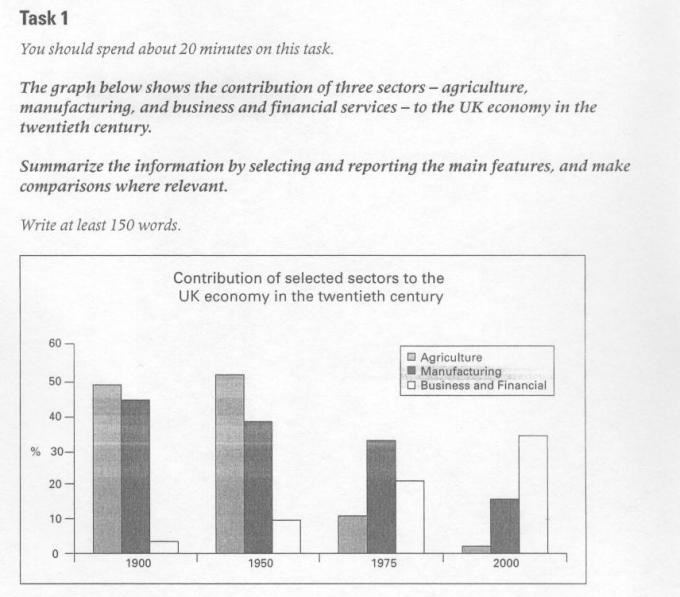
The bar graph illustrates the dotation made by agriculture, manufacturing and business and financial services to the British economy throughout the 20 th century.
Overall, agriculture and manufacturing services showed a downward trend over the century, conversely, business and financial service showed an upward trend.
Firstly, agriculture service contributed roughly 50 % in the beginning, then it reached a peak of approximately 53 %. Afterwards, the pattern rapidly decreased by five times, and tailed off at just above 2 %
Secondly, manufacturing service, which pattern was downward, started at nearly 45 % then gradually declined by almost 3 times in 2000.
Finally, business and financial service, which demonstrated likewise trend as manufacturing service, but in another direction. The pattern settled off at 5 % then rose gradually to almost 35 %.
To sum up, it clearly seen that agriculture and manufacturing services encountered significant reduction, while business and financial service became more and more important during the century. (158 words)
please, check my essay and correct mistakes
The bar graph illustrates the dotation made by agriculture, manufacturing and business and financial services to the British economy throughout the 20 th century.
Overall, agriculture and manufacturing services showed a downward trend over the century, conversely, business and financial service showed an upward trend.
Firstly, agriculture service contributed roughly 50 % in the beginning, then it reached a peak of approximately 53 %. Afterwards, the pattern rapidly decreased by five times, and tailed off at just above 2 %
Secondly, manufacturing service, which pattern was downward, started at nearly 45 % then gradually declined by almost 3 times in 2000.
Finally, business and financial service, which demonstrated likewise trend as manufacturing service, but in another direction. The pattern settled off at 5 % then rose gradually to almost 35 %.
To sum up, it clearly seen that agriculture and manufacturing services encountered significant reduction, while business and financial service became more and more important during the century. (158 words)
Top answer
I've highlighted the major problems. If you fix them and re-post, we can work on the rest. The bar graph illustrates the dotation made by agriculture, manufacturing and business and financial services to the British economy throughout the 2 0 t h century.
- I've highlighted the major problems.
- If you fix them and re-post, we can work on the rest.
- The bar graph illustrates the dotation made by agriculture, manufacturing and business and financial services to the British economy throughout the 2 0 t h century.
- Overall, agriculture and manufacturing services showed a downward trend over the century, conversely, business and financial service showed an upward trend.
- Firstly, agriculture service contributed roughly 5 0 % in the beginning, then it reached a peak of approximately 5 3 % .
Get the Weekly English Kit 📬
New words, one handy idiom, and a 2-minute quiz — delivered to your inbox to keep your streak alive.
3 Answers
0
I've highlighted the major problems. If you fix them and re-post, we can work on the rest.
The bar graph illustrates the dotation made by agriculture, manufacturing and business and financial services to the British economy throughout the 20 th century.
Overall, agriculture and manufact
The bar graph illustrates the dotation made by agriculture, manufacturing and business and financial services to the British economy throughout the 20 th century.
Overall, agriculture and manufact
0
The bar graph illustrates the contribution made by agriculture, manufacturing and business and financial services to the British economy throughout the 20th century.
Overall, agriculture and manufacturing patterns showed a downward trend over the century, conversely, business and financial pattern showed an upward trend.
Firstly, agriculture service contributed roughly 50% in th
Overall, agriculture and manufacturing patterns showed a downward trend over the century, conversely, business and financial pattern showed an upward trend.
Firstly, agriculture service contributed roughly 50% in th
0
You have a fundamental misunderstanding.
The three sectors being compared are :
1. Agriculture - growing plants for food, decoration or landscaping.
2. Manufacturing - making stuff in factories
3. Business and financial services - providing a service such as accounting and banking.
A service is an activity based on human labor, skills and knowledge. There is
 Related Questions