
Ielts Writing taks 1
This is the first time that I write ielts task 1. Could you check and evaluate the score help me. Thanks so much.
-----
The line graphs below compares birth rates of China and USA which were altered over 80 years from 1920 to 2000.
Overall, the birth rates of both nations fluctuated rapidly over the period given. Although the two trends were similar in terms of a reduction, a mount of birth rates of the USA a lot of years was higher than that of China.
With regard to the amount of birth rates of USA were counted, it a double reached a high 15% between 1920 and 1950, it reached a low 5% at the same period. This figure then fluctuated about 10% to 15% just over 20 years, from 1950 to 1970. By contrast, between 1970 to 2000, it fell slowly alow 5% to 10%.
Over the same period from 1920 to 1950, in term of birth rates of China reach a low 5%. It peaked at 20% higher than that percentage of USA. Meanwhile, between 1955 and 2000, the birth rates of China decreased rapidly alow 10%, falling to approximately 2% in 2000.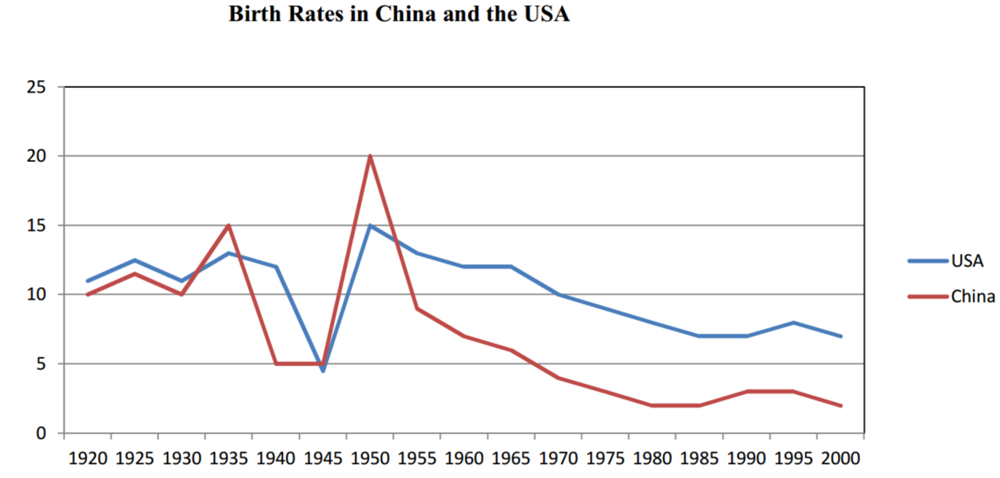
Top answer
Please read my advice for Task 1: IELTS TASK 1: Hints, Tips And Advice The line graphs (incorrect. ) below compares the birth rates of China and USA which were altered (wrong word) over 80 years from 1920 to 2000. The line graph compares the birth rates of China and USA over a period of 80 years from 1920 to 2000.
- Please read my advice for Task 1: IELTS TASK 1: Hints, Tips And Advice The line graphs (incorrect.
- ) below compares the birth rates of China and USA which were altered (wrong word) over 80 years from 1920 to 2000.
- The line graph compares the birth rates of China and USA over a period of 80 years from 1920 to 2000.
- Overall, the birth rates of both nations fluctuated (wrong word) rapidly (wrong adverb.
- The changes were slow most of the time.
Get the Weekly English Kit 📬
New words, one handy idiom, and a 2-minute quiz — delivered to your inbox to keep your streak alive.
Please read my advice for Task 1: IELTS TASK 1: Hints, Tips And Advice
The line graphs (incorrect. There is only one graph.) below compares the birth rates of Chin
 Related Questions