
Ielts writing - Line graph
The line graph compares the proportion of Europeans aged in four different groups visiting to gym monthly or over from 1990 to 2010.
Overall, the percentage of the elderly aged 45 and over was the highest while the proportion of the 18-24 age group was the highest over two decades.
In 1990, at the top position was the percentage of the 25 to 34-year-olds group going to the gym, at approximately 8%. The second-largest proportion of people aged 18-24 stood at 7% and reached a high of around 58% in 2010 before experiencing a slight fluctuation between 50% and 51% from 2004 to 2008, compared to about 49% of those aged 25 to 34.
The proportion of the elderly aged 45 and over was the smallest with around 1% in 1990 then increased to only 20% in the next 20 years, in comparison with the higher percentage of the 35-44 age group standing at 40%.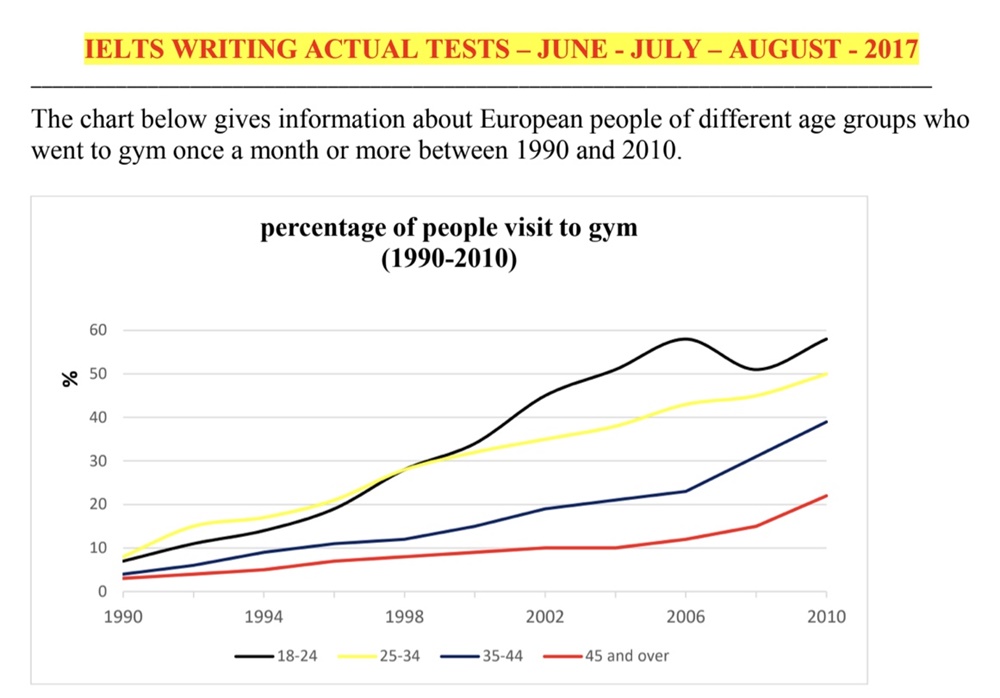
Top answer
The line graph compares the proportion of Europeans aged (Incorrect usage. We age cheese in special cool climate-controlled rooms. We age wine in oak casks.
- The line graph compares the proportion of Europeans aged (Incorrect usage.
- We age cheese in special cool climate-controlled rooms.
- We age wine in oak casks.
- ) in four different age groups who went visiting to a gym at least monthly or over from 1990 to 2010.
- (incomplete.
Get the Weekly English Kit 📬
New words, one handy idiom, and a 2-minute quiz — delivered to your inbox to keep your streak alive.
The line graph compares the proportion of Europeans aged (Incorrect usage. We age cheese in special cool climate-controlled rooms. We age wine in oak casks. We do not age people!) in four different age groups who went visiting to a gym
 Related Questions