
Ielts writing academic
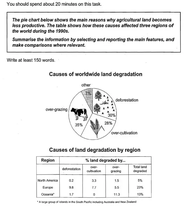
The pie chart gives details on many factors that declined agricultural land's productivity. The table demonstrated three different regions of the globe that were affected during the 1990s
Overall, the main reason that caused degradation in land was over-grazing. Besides that, Europe was the region that had the proportion of degraded land higher than the rest.
It can be easily seen from the pie chart that over-grazing made up more than a quarter of the percentage of factors that had a poor effect on worldwide land. Following was deforestation and over-cultivation that constituted 30% and 28% respectively. Meanwhile, just only a mere 7% of other features that have an effect on land.
Europe was the region that heavily affected by these cause with the total of 23% of land was degraded. Nearly 9.8% was allocated by deforestation and 7.7% came from over-cultivation that were the highest, compared to the remain. North America was the region that was less effected with just only 5% of agricultural land had unproductiveness. All of the factors allocated just under a very small amount with 0,2%, 3,3% and 1,5% respectively for 3 categories in the table. Oceania which gained a 13% impressively had a minority composed of over-gazing compared to 2 region, while other factors accounted just under 2%.
Top answer
Sorry, but I cannot read anything on that postage stamp image.
- Sorry, but I cannot read anything on that postage stamp image.
Get the Weekly English Kit 📬
New words, one handy idiom, and a 2-minute quiz — delivered to your inbox to keep your streak alive.
Sorry, but I cannot read anything on that postage stamp image.
The pie chart gives details on many factors (That is not what is on the pie chart.) that declined agricultural land's (unnatural) productivity. The table demonstrated (wrong verb) three different regions of the globe that
 Related Questions