
Ielts wiritng task 1
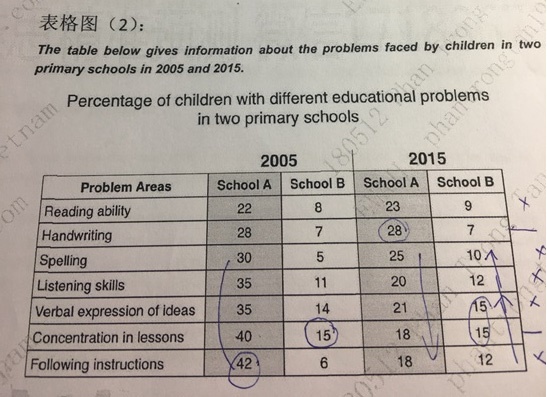
The table illustrates the percentage of different issues that students of two schools have to deal with between 2005 and 2015. Overall, School A had the higher proportion of student’s problems than that of School B. However, in 2015, School A had tried to reduce most of their difficulties, while there was an increase in the percentage of School B’s issues.
To begin with School A, except Reading ability and Handwriting, the percentage of the five other problems had decreased after 10 years. Concentration in lessons and Following instructions which both had the proportion from or over 40% plunged by more than half in 2015. However, the School A’s pupils found it more difficult in reading when the percentage of this problem increased by 1%.
Moving to School B, there were more students in this school had educational problems when the figure for most of these difficulties had grown after 10 years. Not only did the percentage of Listening skills and Verbal expression of ideas rose by 1%, that of Spelling and Following instructions increased by half in 2015. Additionally, there was no change in the Handwriting and Concentration problem.
Top answer
The table illustrates compares two primary schools in terms of the percentage s of students who faced different issues that students of two schools have to deal with between in 2005 and 2015. Overall, in 2005, School A had the higher proportion s of studen t s who had problems than that of did School B. However, in by 2015, School A had tried managed to reduce most of their difficulties, while there was an increase in the percentage of problems in School B.
- The table illustrates compares two primary schools in terms of the percentage s of students who faced different issues that students of two schools have to deal with between in 2005 and 2015.
- Overall, in 2005, School A had the higher proportion s of studen t s who had problems than that of did School B.
- However, in by 2015, School A had tried managed to reduce most of their difficulties, while there was an increase in the percentage of problems in School B.
- ’s issues.
- To begin with , in School A, except for r eading ability and h andwriting, the percentag e s of the five other categories of problems had decreased after 10 years.
Get the Weekly English Kit 📬
New words, one handy idiom, and a 2-minute quiz — delivered to your inbox to keep your streak alive.
The table illustrates compares two primary schools in terms of the percentages of students who faced different issues that students of two schools have to deal with between in 2005 and 2015.
Overa
 Related Questions