
IELTS- TASK1: The weekly expenses in the UK and The US in 2010
Question: The graphs below show a comparison of the weekly expenses in the UK and the US, in 2010
Answer:
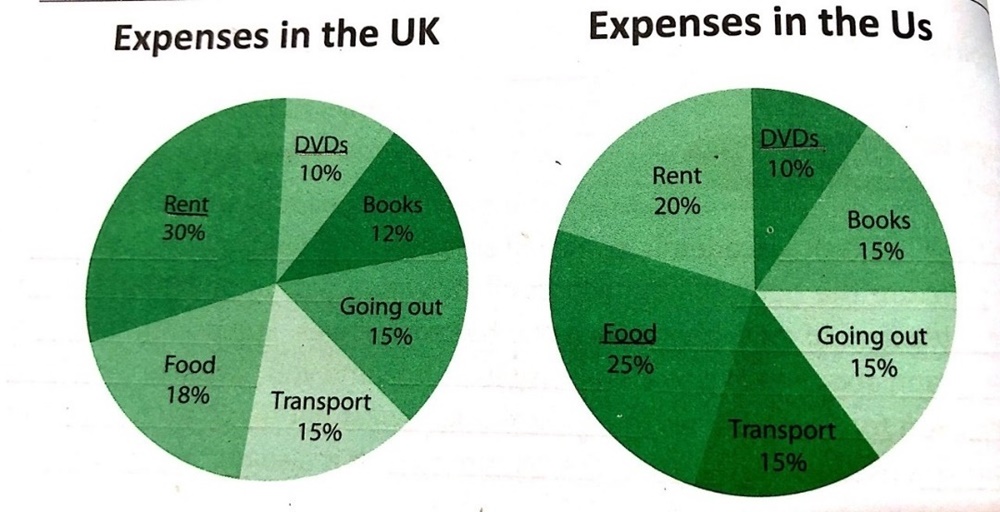
The pie chart illustrates the expenditure proportion of the six main cost types in America and Britain in 2010. Overall, expense of housing and food were the primary parts of the weekly expenses in both of the countries.
In United Kingdom, the percentage of rent expenses was 30% and the expenses of food accounted for 18%. However, DVDs and Books were expended the least popularly with 10% and 12% respectively. The expense proportion of traveling was as much as that of transport, which was 15%.
Turning to the United State, the highest proportion of the weekly expenses was food with 25% while it was accommodation costs in the UK. The cost of rent in America accounted for 20%, which was the second highest percentage. Going out for entertainment, books and transport expenses had the same percentage with 15%. Similar to Britain, DVDs was the most uncommon expenses in the US with 10%.
(152 words)
Please check and correct my essay. Thank you very much. 
Top answer
Your word count, 152, is just barely over the minimum. You should write a little more as a safety margin. ) illustrates (wrong word) the expenditure proportion of the six main cost types categories of expenses .
- Your word count, 152, is just barely over the minimum.
- You should write a little more as a safety margin.
- ) illustrates (wrong word) the expenditure proportion of the six main cost types categories of expenses .
- in America and Britain in 2010.
- (Your paragraph is incomplete.
Get the Weekly English Kit 📬
New words, one handy idiom, and a 2-minute quiz — delivered to your inbox to keep your streak alive.
Your word count, 152, is just barely over the minimum. You should write a little more as a safety margin.
The pie chart (There is more than one of these!) illustrates (wrong word) the expenditure proportion of the six main
The two pie charts give information about the percentage of expenses done weekly on rent,food, transport,books ,DVDs and going out by British and American.
 Related Questions