
IELTS task1 (PIE)
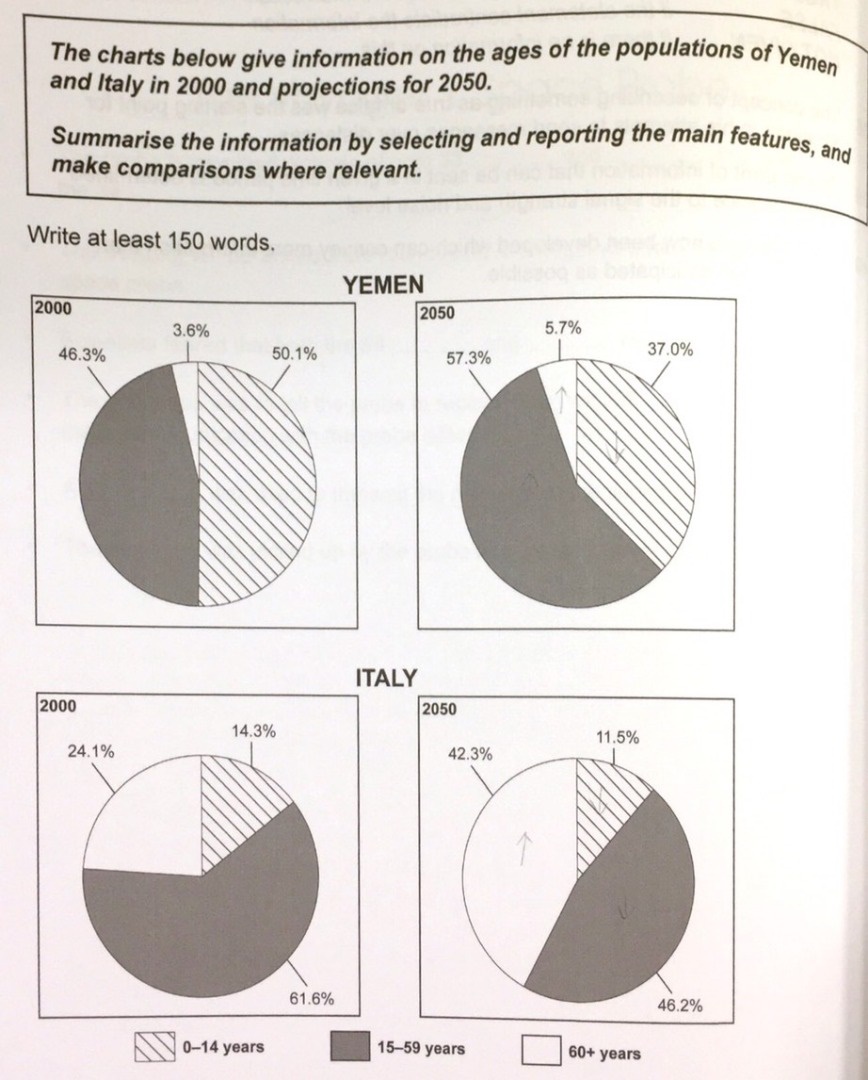
The pie charts indicate the consistent of populations in different ages in Yemen and Italy in 2000 and 2050. Overall, in both countries, 0-14 year-old people in 2050 will be less than the previous time.
In 2000, people in the 0-14 age group was the largest number in Yemen with 50.1%, which occupied a half, followed by 15-59 year-olds, taking up 46.3%. The smallest number was the population of people 60 and over, which was 3.6%. For Italy, 15-59 year old people represented third-fifth, which was 61.6%. People in the 60 and over age group stood for nearly a quarter with 24.1%.
In the projections, the number of people aged 15-59 will increase to 57.3% in Yemen in 2050. At the same time, the figure of 0-14 year-olds will decline to 37%. In addition, in Italy, the number of 15-59 year-old people will experience a similar trend, decreasing to 46.2%. However, the figure for people aged 60 and over will have growth to 42.3% in 2050. Moreover, 0-14 year-olds was one-tenth, which was 11.5%.
Top answer
The pie charts (how many) indicate (wrong word. ) the consistent (Incorrect word. ) in Yemen and Italy in 2000 and 2050.
- The pie charts (how many) indicate (wrong word.
- ) the consistent (Incorrect word.
- ) in Yemen and Italy in 2000 and 2050.
- Overall, in both countries, 0-14 year-old people in 2050 will be less than the previous time.
- (Wrong paragraph structure.
Get the Weekly English Kit 📬
New words, one handy idiom, and a 2-minute quiz — delivered to your inbox to keep your streak alive.
The pie charts (how many) indicate (wrong word. This is not a good synonym.) the consistent (Incorrect word. It is not even close.) of populations in different ages (what are the ages?) in Yemen and Italy in 2000 and 2050. Overall, i
 Related Questions