
IELTS-Task1
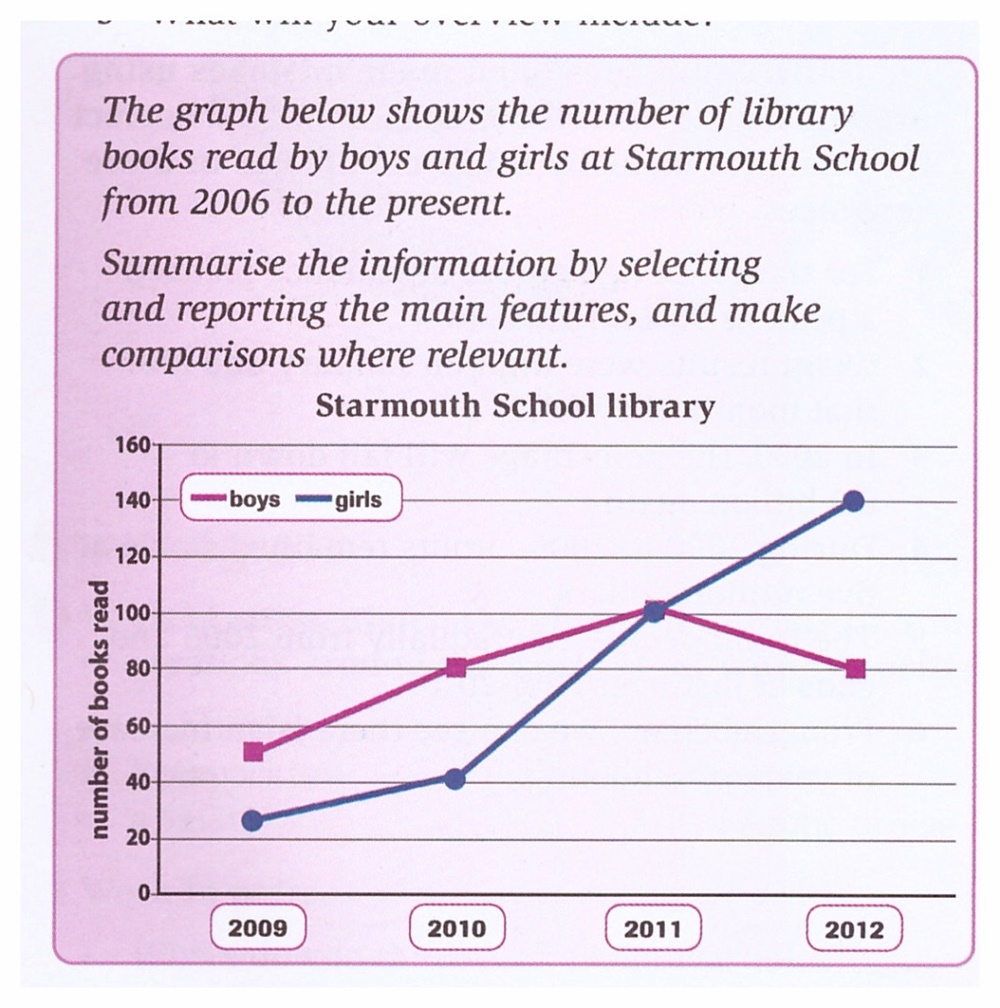
The line graph gives information about the number of library books that were read by boys and girls at Starmouth School between 2006 and the present.
Overall, there were different trend for boys and girls. The girls reading have increased dramatically in four years. Although the boys read more books than the girls until 2011, their reading has decreased in 2012.
The number of books read by girls started at about 25 in 2009, It was a slight rise after one year and reached to 40. From 2010 to 2012, it has grown sharply by 100 and reached to 100 in 2011 and 140 in 2012.
Boys read approximately 50 books in 2009, their reading climbed gradually and reached the highest number at 100 in 2011. In this year both categories have the same number. After that, they have different pattern and it has dropped dramatically and reached to 80 in 2012.
Top answer
The line graph gives information about the number of library books that were read by boys and girls at Starmouth School between 2006 and the present. Overall, there were different trend (wrong form) for boys and girls. The girls (wrong form) reading have increased (wrong verb form) nearly sevenfold over the period dramatically in four years .
- The line graph gives information about the number of library books that were read by boys and girls at Starmouth School between 2006 and the present.
- Overall, there were different trend (wrong form) for boys and girls.
- The girls (wrong form) reading have increased (wrong verb form) nearly sevenfold over the period dramatically in four years .
- (wrong expression) Although the boys read more books than the girls before until 2011, their reading has decreased in 2012.
- The number of books read by girls started at about 25 in 20 09, (wrong punctuation) It was a slight rise after one It rose by 15 the next year and reached to 40.
Get the Weekly English Kit 📬
New words, one handy idiom, and a 2-minute quiz — delivered to your inbox to keep your streak alive.
The line graph gives information about the number of library books that were read by boys and girls at Starmouth School between 2006 and the present.
Overall, there were different trend (wrong form) for boys and girls. The girls (wrong form) reading have incre
 Related Questions