
IELTS Task 1 Writing
Hi
Please review this IELTS Task 1 writing for me.
The graph gives information about the age of the population of Iceland between 1990 and 2020.
Summarize the information by selecting and reporting the main features, and make comparisons where relevant.
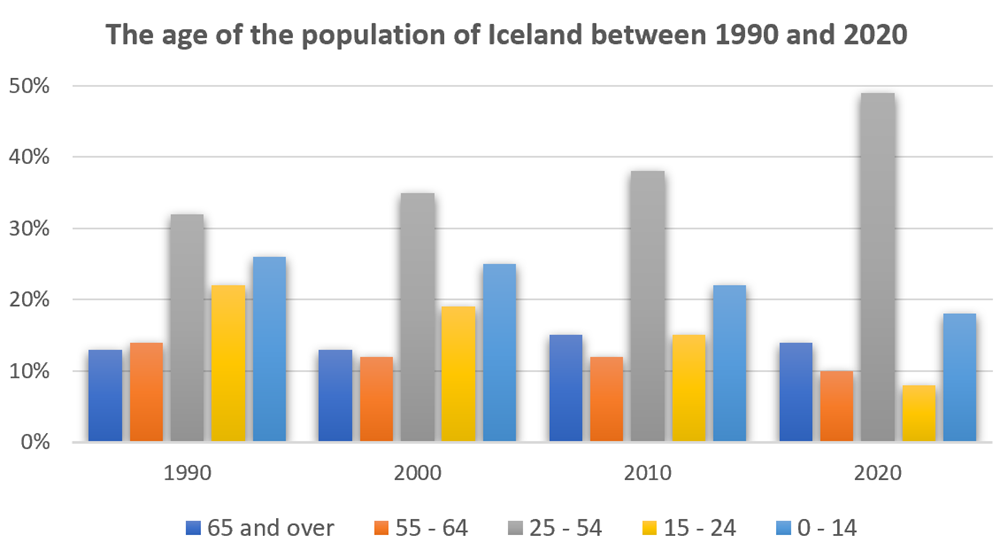
The bar chart shows the population in five age ranges in Iceland in the years 1990, 2000, 2010 and 2020. The ranges are 0 to 14, 15 to 24, 25 to 54, 55 to 64, and 65 and over.
Overall, people in the range 25 to 54 had the highest percentage share in Iceland’s population in all of the four years. While the percentages of Icelanders in the range 65 and over were consistent in these years, those of in the range from 0 to 14 gradually reduced.
In detail, the percentage of those from 25 to 64 which was a little over 30 in 1990 peaked at almost 50 in 2020. However, at around 25 in 1990, the percentage of those from 0 to 14 got reduced to 9 in 2020. While the percentages of those from 55 to 64 and 65 and over remained more or less consistent and equal in the four years, those in the range from 15 to 24 gradually decreased from a little over 20 in 1990 to around 7 in 2020.
Top answer
The bar chart [ 1 ] shows tracks the population of Iceland in five age ranges (0 to 65 and above) over four years – in Iceland in the years 1990, 2000, 2010 and 2020. The ranges are 0 to 14, 15 to 24, 25 to 54, 55 to 64, and 65 and over. Overall, people in the range aged 25 to 54 had the highest percentage share in Iceland’s population in all of the four year s, and that share increased with time .
- The bar chart [ 1 ] shows tracks the population of Iceland in five age ranges (0 to 65 and above) over four years – in Iceland in the years 1990, 2000, 2010 and 2020.
- The ranges are 0 to 14, 15 to 24, 25 to 54, 55 to 64, and 65 and over.
- Overall, people in the range aged 25 to 54 had the highest percentage share in Iceland’s population in all of the four year s, and that share increased with time .
- While the percentag e of Icelanders in the range 65 55 and older over were consistent in these years, remained relatively stable, those of in the range from 0 to 14 gradually [ 2 ] reduced decreased slightly.
- [ 3 ] In detail, the percentage of those from Icelanders aged 25 to 54 [ 4] 64 which was represented a little over 30 % of the total population in 1990 , but that figure subsequently rose and peaked at almost 50 % in 2020.
Get the Weekly English Kit 📬
New words, one handy idiom, and a 2-minute quiz — delivered to your inbox to keep your streak alive.
The bar chart [ 1] shows tracks the population of Iceland in five age ranges (0 to 65 and above) over four years – in Iceland in the years 1990,
 Related Questions