
IELTS Task 1 Writing
Hi
Please check my IELTS Task 1 writing.
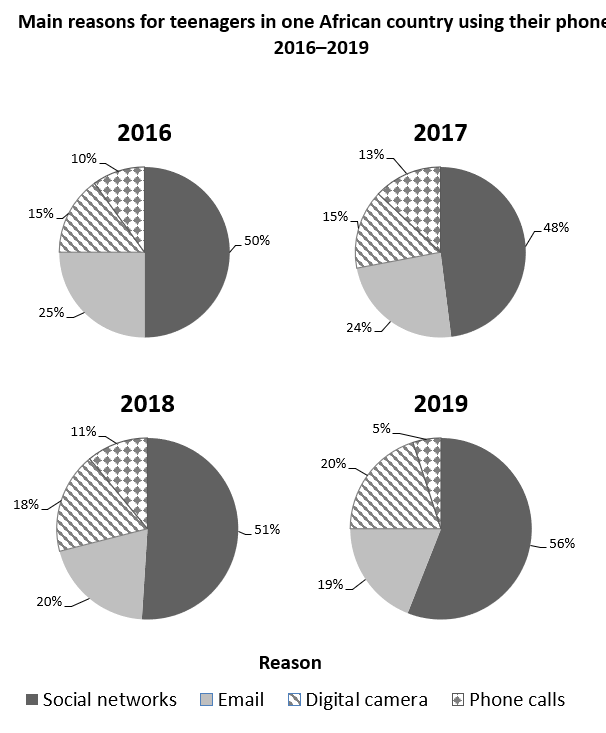
The pie charts present the results of the survey on the reasons for the use of phone by teenagers in an African country, in percentages.
The survey which asked teenagers if they used their phones for making calls, social networking, digital camera or emails found that majority of them used their phones for social networking. The results showed that the least percentage of them used their phones for making calls.
While around 50 percent of teenagers used their phones for social networking from 2016 to 2019, those who used them for making calls dropped to 5 percent in 2019 from 13 in 2016. Additionally, in 2016, the percentage ratio of those who used their phones for emails and digital camera was 25 and 15. However, in 2019, teenagers using the phones for digital camera was marginally higher than those using the phones for emails. Overall, while teenagers using their phones for social networking and digital camera increased in the four-year period, the number using them for email and making calls reduced.
Top answer
Who wrote that summary?
- Who wrote that summary?
Get the Weekly English Kit 📬
New words, one handy idiom, and a 2-minute quiz — delivered to your inbox to keep your streak alive.
The first two paragraphs are not well thought out. You can pack a lot more information into that many words! Where are the years?
Also, you need to structure the rest of your summary. Focus on sectors or years. Don't just write down ideas as they come to your mind, as in the above.
Finally, be mindful of your phrasing. For example, "percentage ratio" is wrong, and "reduce" is usual
 Related Questions