
IELTS task 1: Using phones in school
These pie charts make comparison of reasons why young people use their phone in 4 particular years namely 2016, 2017, 2018, 2019 in an African country.
In the whole, they spent most of their time on social networks. Meanwhile, time for phone calls was the least in 4 years shown.
Regarding using phone for social networks. Mostly, their rates were around 50%. In 2010, figure for social networks was exactly a half of total time for using phone. Figures kept going up and reached 56% in 2019. The only exception was in 2017 in which figure decreased slightly ( 48%).
Figures for digital camera shared the same experience which increased gradually from 5% in 206 to 20% in 2019. In contrast, figures witness a considerable decline of Email's percentage. After 4 year, figure for email decreased by 6%
It was particular true with phone calls. Time for them declined sharply by a half in 2019, compared to 2016.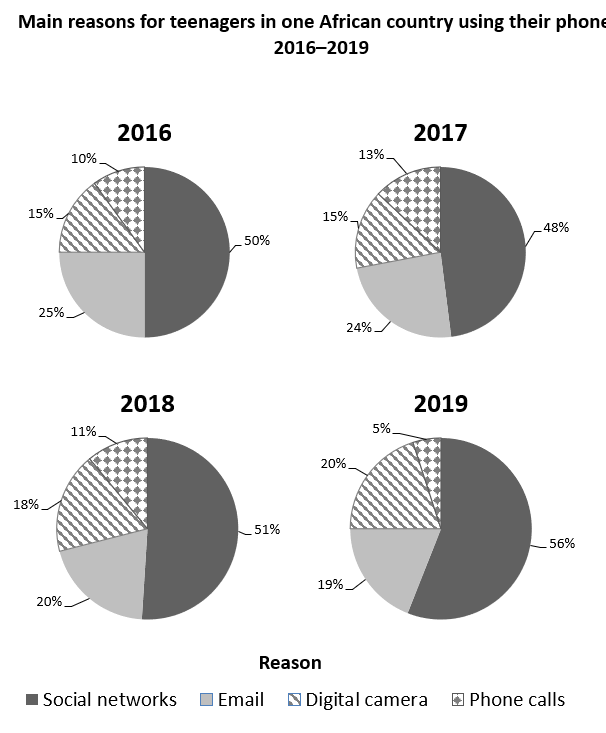
Top answer
These pie charts make comparison of summarize the main reasons why young people teenagers use d their mobile phone in four particular year s, namely 2016 , 2017, 2018, to 201 9, in an African country. In On the whole, they those young people [ 1] spent most ly used of their time on smartphones to access social networks. Meanwhile, time for making phone calls was the least smallest sector in 4 all four year s.
- These pie charts make comparison of summarize the main reasons why young people teenagers use d their mobile phone in four particular year s, namely 2016 , 2017, 2018, to 201 9, in an African country.
- In On the whole, they those young people [ 1] spent most ly used of their time on smartphones to access social networks.
- Meanwhile, time for making phone calls was the least smallest sector in 4 all four year s.
- shown.
- Regarding U sing the phone for social networks .
Get the Weekly English Kit 📬
New words, one handy idiom, and a 2-minute quiz — delivered to your inbox to keep your streak alive.
These pie charts make comparison of summarize the main reasons why young people teenagers used their mobile phone in four particular year
 Related Questions