
IELTS TASK 1: The bar chart below shows the percentage of australian mẹn and women in different age groups who did regular physical activity in 2010.
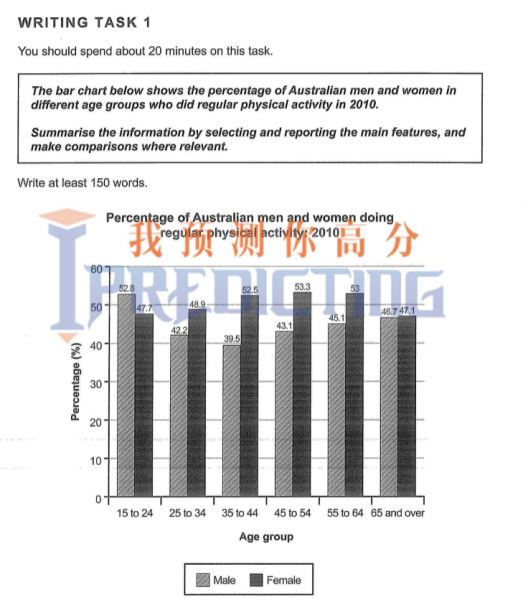
The bar graph illustrates the proportion of 6 various age group Austrialian female and male who had regular workout in the year 2010.
As can be seen from the graph, it is clearly evident that women had the highest the numbers for people who engaged in physical ativities, exception to in term of teenagers group
In almost all groups, the percentage of women was higher than the figure for men. The only exception was for the age range between 15 and 24 year, 52,8% of males and 47,7% of females in this who participated in daily exercises.
The largest difference in data for people of the distinctive gender was recorded for the group from 35 to 44 years old, approximately for 13%. The opposite situation can be noticed in the seniors group ,only 0,4% female more than male go involeved in regular excercises, accounted for 46,7% and 47,1% in respectively.
Top answer
Please do not put the essay instructions in the "Subject" line. Put it with your answer in the message body. n and women in different age groups who did regular physical activity in 2010.
- Please do not put the essay instructions in the "Subject" line.
- Put it with your answer in the message body.
- n and women in different age groups who did regular physical activity in 2010.
- )
Get the Weekly English Kit 📬
New words, one handy idiom, and a 2-minute quiz — delivered to your inbox to keep your streak alive.
Please do not put the essay instructions in the "Subject" line. Put it with your answer in the message body.
Subject: Please review my IELTS essay
Message body:
Topic: The bar chart below shows the percentage of australian m?n and women in different age groups who did regular physical activity in 2010.
(Please add the rest of the instructions.)
I have highlighted the mistakes.
The bar graph illustrates the proportion of 6 six various age group (wrong form) Austrialian (wrong spelling) female (wrong form) and
The following graph illustrates the percentage of Australian men and women who performed regular exercise in 2010.
Overall, the majority of women did particular more exercise in the old ages than men. The average of women between 45 to 54 years old was the highest percentages (53.3%) while the highest average (52.8) of men practiced their exercise in the young ages of 15 to 24.
A
 Related Questions