
IELTS TASK 1: The activities that Australian and New Zealand children enjoy doing the most in 2017
@ Information: The graph below shows information about the activities that Australian and New Zealand children enjoy doing the most in 2017.
:
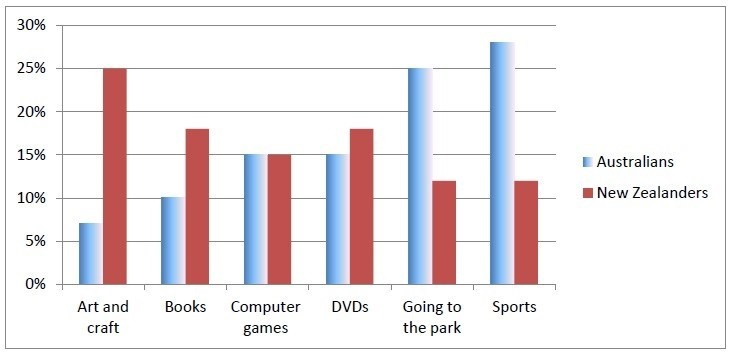
The bar graph represents the data about recreational activities of the young Australian and New Zealander in 2017. In general, the young in Australia preferred to do outdoor activities while New Zealand children liked participating in indoor activities.
For Australian children, the youths were involved in the most outdoor activities such as going to the park (25%) and sports (above 27%). The proportion of the young playing computer games was as much as that of children enjoying DVDs, just 15%. Art and craft and Books had the least percentage of the participants with around 6% and 10% respectively.
In the other hand, there was a contrasting trend in leisure activities of the children in New Zealand compared to in Australia. The activity having the highest joining rate by the youths was art and craft with 25%. Books and DVDs accounted for the same percentage (about 17%). Finally, the most uncommon activities were traveling to the park and playing sports with 13%.
(161 words)
:
Thank you for reading all of my essay. I hope that you will give your comments here and show me some errors of my essay in order to improve my writing
(if you give me an estimated score of this essay in IELTS score range, I will appreciate your kindness).
Thank you and best regards
Top answer
htm The bar graph represents (wrong word) the data about (That is too vague and general. ) in 2017. (Your description is incomplete.
- htm The bar graph represents (wrong word) the data about (That is too vague and general.
- ) in 2017.
- (Your description is incomplete.
- What are these activities?
- How many are there?
Get the Weekly English Kit 📬
New words, one handy idiom, and a 2-minute quiz — delivered to your inbox to keep your streak alive.
Please read my general advice for Task 1 essays:
https://www.englishforums.com/English/IeltsTaskHintsTipsAdvice/bxgnkx/post.htm
The bar graph represents (wrong word) the
 Related Questions