
IELTS Task 1: Table. Dear teachers, could you please give me some comments and give band score to my task? Thank you very much
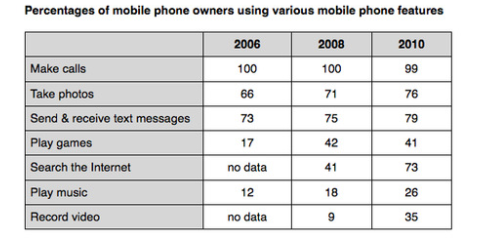
The table compares the proportion of mobile phone users in terms of different functions over the period of 3 years, from 2006 to 2010.
It is obvious that everybody used mobile phones to make calls during the time given. Also, the percentage of people using cellphones to play games experienced the most dramatic change by 2010.
In 2006, 100% of mobile phones were used to call but only 12% of phone owners used them for music playing purpose, which shows a considerably long gap of two areas (88%). By 2010, there was only 1% decreased in the rate of people using cellphones to make calls. This year also saw the sudden skyrocketing of percentage of people playing music via their mobile phones (26%).
There was an upsurge increase in the percentage of mobile gamers, at 42% in 2008 and 41% in 2010 regardless of their modest figure (at 17%) in 2006. On the other hand, the proportion of people using their phones for texting messages undergo a slightly rise of 6%% from 2006 to 2010, compared with 10% increased in the mobile photographers. 41% of mobile phones were used for surfing webs in 2008 and 9% were used for recording in spite of unknown figures for those in 2006. By 2010, there were also simultaneously rises in those categories ( 73% for searching in internet and 35% for recording the video)
Top answer
You need to organize your paragraphs better. The table compares the proportion of mobile phone users who used particular features on their phones in terms of different functions over the period of 3 years , from 2006 to 2010. ( Not precise.
- You need to organize your paragraphs better.
- The table compares the proportion of mobile phone users who used particular features on their phones in terms of different functions over the period of 3 years , from 2006 to 2010.
- ( Not precise.
- ) It is obvious that (Those words add nothing to your essay) E verybody used their mobile phones to make calls during the time given.
- (That is not surprising, because ...
Get the Weekly English Kit 📬
New words, one handy idiom, and a 2-minute quiz — delivered to your inbox to keep your streak alive.
You need to organize your paragraphs better.
The table compares the proportion of mobile phone users who used particular features on their phones in terms of different functions over the period of 3 years, from 2006 to 2010. ( Not precise. "Over three years " means there is a line graph that shows continuous data..)
I
 Related Questions