
IELTS Task 1 sample (Bar graph)
The bar chart shows the literacy rate (% of people who can read and write) by region and gender in 2011. Summarize the information by selecting and reporting the main features, and make comparisons where relevant. Write at least 150 words.
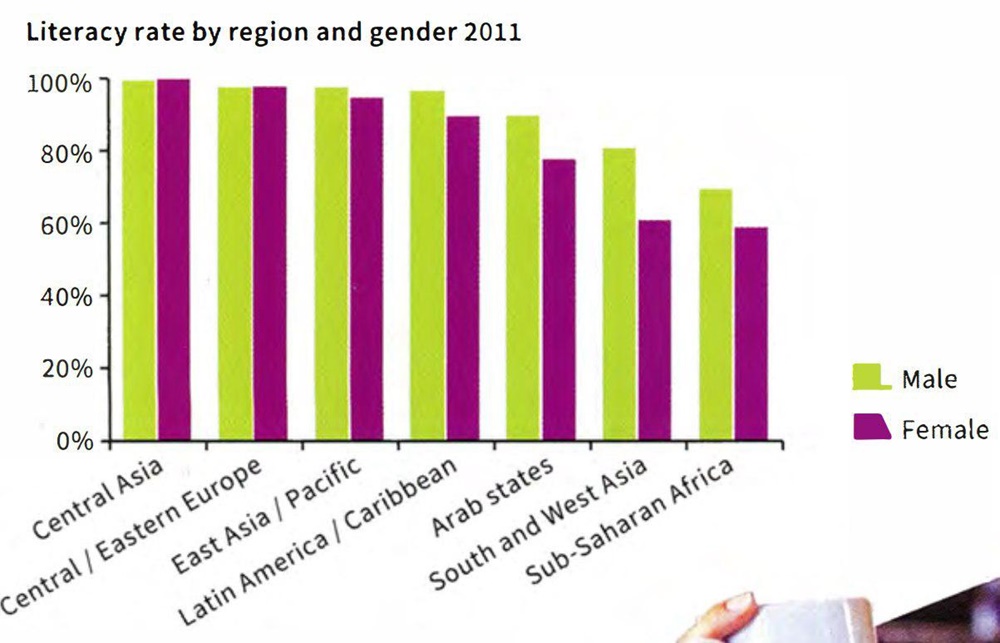
The graph shows the percentage of people who are able to read and write by region and gender in 2011. The chart includes some information about seven different parts of the world like some parts of Asia, Europe, Africa, the Americas, etc. It can be seen that all surveyed men and women from central Asia and Europe are literate, while approximately 65% of subsaharan African people on average could read and write.
Among investigated regions, only two regions showed the same literacy rate for men and women. For other regions, the portion of literate men was higher than women. This difference between men and women’s literacy rate was maximum for south and west area.
The proportion of literate citizens from Sub-Saharan Africa is less than 70%. This is the least value between all studied regions. The difference in literacy rate for the men reached to around 30% when comparing central Asia and Africa (100% vs 70%). This value was more for women and was about 40%.
It is clear that there is somehow a great difference between literacy rate for people from different parts of the world. Also in any of the regions under investigation, the percentage of literate women was not higher than men.
Top answer
The graph (bar chart) shows the percentage of people who are able to read and write by region and gender in 2011. The chart includes some this information about seven different parts of the world like some parts of Asia, Europe, Africa, and the Americas , etc . ) Start a new paragraph here.
- The graph (bar chart) shows the percentage of people who are able to read and write by region and gender in 2011.
- The chart includes some this information about seven different parts of the world like some parts of Asia, Europe, Africa, and the Americas , etc .
- ) Start a new paragraph here.
- Do not write about the data in the first paragraph.
- ) could read and write.
Get the Weekly English Kit 📬
New words, one handy idiom, and a 2-minute quiz — delivered to your inbox to keep your streak alive.
The graph (bar chart) shows the percentage of people who are able to read and write by region and gender in 2011. The chart includes some this information about seven different parts of the world like some parts of Asia, Europe, Africa, and the
The graph shows the percentage of people who can write and read by region and gender in 2011. The chart includes some information about seven different parts of the world like some parts of Asia, Europe, Africa, the Americas, and so forth. Overall, we can see Central Asia and Eastern Europe had the highest literacy in regions with 100 percent and 98 percent. There were five regions show differ
The bar chart shows the literacy rate for both male and females in seven regions in 2011 consequently that the horizontal axis lists the regions and the vertical axis shows the percentage. Overall, it can be seen that the rate literacy of men and women was always equal or slightly higher than the rate of gender.
Only two of the investigated regions include Central Asia and Central/ Eastern
Intro : The graph shows the percentage of people who are able to read and write by region and gender in 2011.
Overview : The chart includes some information about seven different parts of the world like some parts of Asia, Europe, Africa, the Americas, etc.
 Related Questions