
[ielts task 1] please help my with my writing!
The bar chart below shows the percentage of people living alone in five different age groups in the USA between 1850 and 2000.
The bar chart demonstrates the number of American citizens living separately by percentage in 5 age groups from 17 to 64 during a period of 150 years starting from 1850.
Overall, the proportion of the elderly living by themselves started to increase sharply in the 1950s. Besides, few American inhabitants of all age groups lived alone from 1850 to 1990.
No figure was recorded in the proportion of people aged from 17 to 26 living alone between 1850 and 1990. This figure stood at nearly 2% in 1950 before it rose to 5% five years later. Likewise, at the beginning of the given period, age group 27-36 showed no figure. The percentage of people aged from 27 to 36 then climbed and peaked 8% in 2000, which was fourfold its figure a century ago.
In 1850, the proportion of age group 37-46 was equal to that of age group 47-54 with 2.5%. The figure for both age groups went up with the figure of age group 47-54 was 6% higher than that of age group 37-46 in 2000. During the given period, the proportion of age group 55-64 rocketed with a peak of 17% in the final year.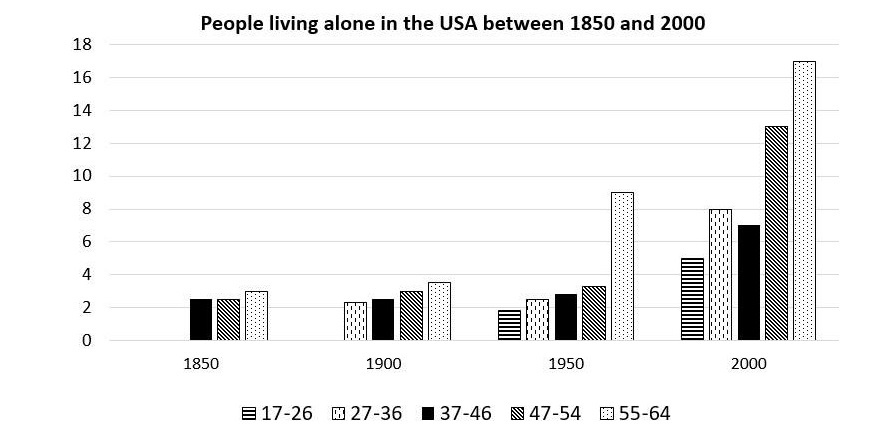
Top answer
I have given you feedback many times, but you never say "thank you" for my work. I don't know if you pay any attention to it. Why should I give you any more?
- I have given you feedback many times, but you never say "thank you" for my work.
- I don't know if you pay any attention to it.
- Why should I give you any more?
- The bar chart below shows the percentage of people living alone in five different age groups in the USA between 1850 and 2000.
- The bar chart demonstrates shows the number (The chart does not plot numbers.
Get the Weekly English Kit 📬
New words, one handy idiom, and a 2-minute quiz — delivered to your inbox to keep your streak alive.
I have given you feedback many times, but you never say "thank you" for my work. I don't know if you pay any attention to it. Why should I give you any more?
The bar chart below shows the percentage of people living alone in five different age groups in the USA between 1850 and 2000.
The bar chart demonstrates
 Related Questions