
IELTS TASK 1 - Please Check This Summary!!!
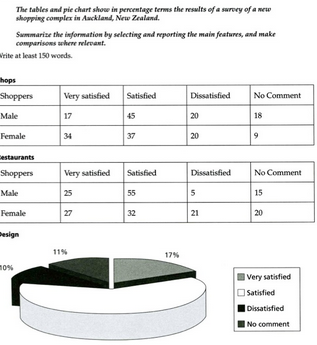
The two tables and pie chart illustrate how shoppers felt about three aspects of a new shopping center: shops, restaurants, and design in Auckland, New Zealand in 2006 (the sample answer includes this year but the question doesn't), which vary according to the gender in tables and for all in a pie chart.
Overall, the majority of respondents were happy with the new shopping complex. However, the proportion of those who were very satisfied was lower than the percentage of shoppers who felt just satisfied and the restaurants received a more positive rating overall among men than women.
As can be seen from shops, the proportion of male respondents who had the extreme satisfaction was 17%, less two-fold than female (34%). The opposite was true for the percentage of not making any comment about shops (18% men compared to nine percent women). Interestingly, the impression of unsatisfaction was the same for both genders (20%).
For restaurants, there were almost four times more dissatisfied females than males (21% women against 5% men). As regards design, the shopping complex seemed to make a good impression on both sexes with a high satisfaction rate (62% satisfied, 17% very satisfied with only 10% dissatisfied and 11% no comment).
Top answer
The two tables and pie chart illustrate how shoppers felt about three aspects of a new shopping center: shops, restaurants, and desig n, in Auckland, New Zealan d. in 2006 (the sample answer includes this year but the question doesn't), which vary The tables provide a breakdown according to the gend er, in tables and for all in a but the pie chart does not . Overall, the majority of respondents were happy with the new shopping complex.
- The two tables and pie chart illustrate how shoppers felt about three aspects of a new shopping center: shops, restaurants, and desig n, in Auckland, New Zealan d.
- in 2006 (the sample answer includes this year but the question doesn't), which vary The tables provide a breakdown according to the gend er, in tables and for all in a but the pie chart does not .
- Overall, the majority of respondents were happy with the new shopping complex.
- However, the proportion of those who were very satisfied was lower than the percentage of shoppers who felt just satisfie d, and the restaurants received a more positive rating overall among men than women.
- As can be seen from the opinions about the shops, the proportion of male respondents who had the extreme satisfaction reported being highly satisfied was 17%, less two-fold than exactly half that for femal e s (34%).
Get the Weekly English Kit 📬
New words, one handy idiom, and a 2-minute quiz — delivered to your inbox to keep your streak alive.
The two tables and pie chart illustrate how shoppers felt about three aspects of a new shopping center: shops, restaurants, and design, in Auckland, New Zealand. in 2006 (the sample answer includes this year but the question doesn't), which vary The tables provide a
 Related Questions