
IELTS task 1. Please check my grammar please! Thank you!
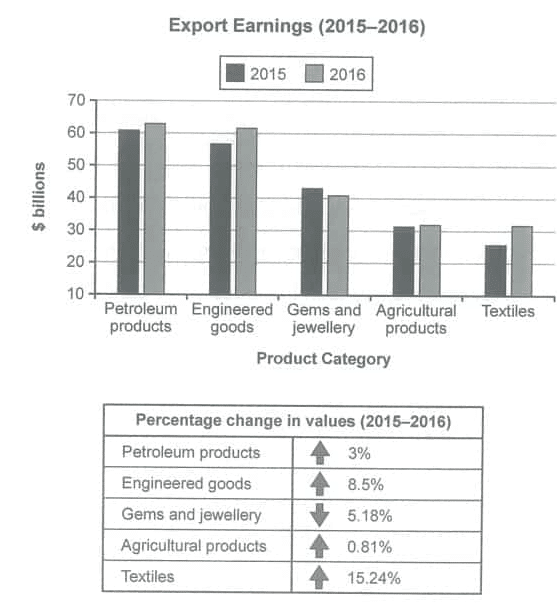
The chart below shows the value of one country's exports in various categories during 2015 and 2016. The table shows the percentage change in each categories of exports in 2016 compared with 2015.
------------------------------------------------------------------------------------------------------
My essay:
The bar graph compares the amount of export money earned by five categories: Petroleum goods, engineered goods, gems and jewellery, agricultural products, and textiles between 2015 and 2016. Also, the table gives the changes in value of these areas.
Overall, only gems and jewellery decreased in both its value and percentage change from 2015 to 2016. Furthermore, while the money earned by petroleum products was the highest, that by textiles was in the opposite.
In 2015, the value of petroleum stuffs was the highest, at over 60$ billion, followed by engineered goods (nearly 58 $ billion), gems and jewellery (around 44$ billion), agricultural products (31$ billion), and textiles (25$ billion approximately). In 2016, the export money of textiles increased steadily to be the same as that of argicultural exports, at about 31$ billion.
The percentage change in values is parrallel with the export earnings. The difference in textiles was significant, at 15.24%, and 6.74% more than in engineered products. The petroleum products went up 3% in 2016, and 0.81% was the increase in the value of agricultural one. In contrast, there was a decrease in the percentage of gems and jewellery, at 5.18%.
Top answer
n 8023 The chart below shows the value of one country's exports in various categories during 2015 and 2016. The table shows the percentage change in each categories of exports in 2016 compared with 2015 Can you find the grammatical error in the topic?
- n 8023 The chart below shows the value of one country's exports in various categories during 2015 and 2016.
- The table shows the percentage change in each categories of exports in 2016 compared with 2015 Can you find the grammatical error in the topic?
Get the Weekly English Kit 📬
New words, one handy idiom, and a 2-minute quiz — delivered to your inbox to keep your streak alive.
Hà Tr?n 8023The chart below shows the value of one country's exports in various categories during 2015 and 2016. The table shows the percentage change in each categories of exports in 2016 compared with 2015
Can you find the grammatical error in the topic?
The bar graph compares the amount of export money earned by five categories: (There are many, many problems with this text. "Export money" is quite bad. The categories do not earn money, so "by five categories" is poor English. ) Petroleum goods, engineered goods, gems and jewellery, agricultural products, and textiles between 2015 and 2016
 Related Questions