
IELTS task 1. Please check my grammar please!
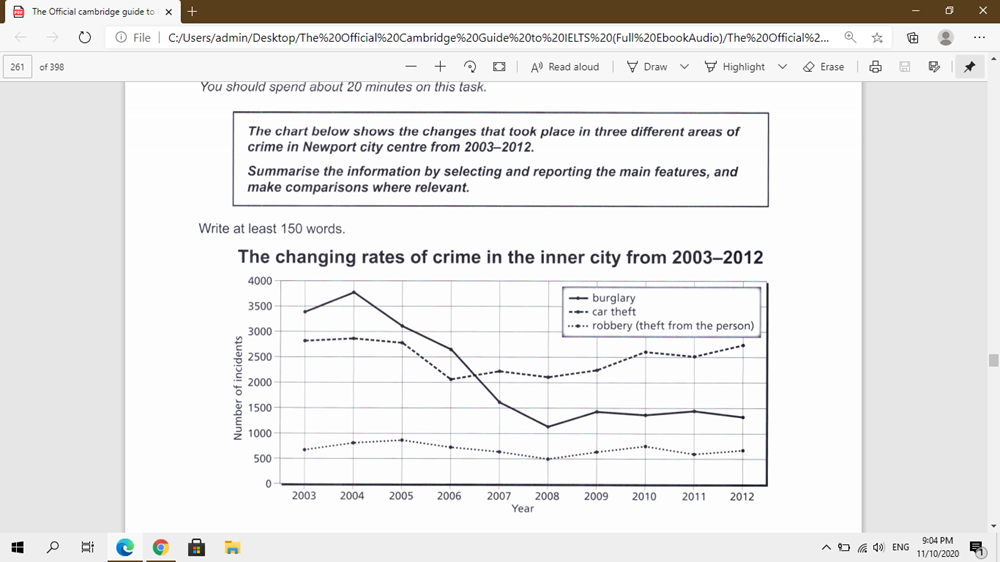
The chart below shows the changes that took place in three different areas of crime in Newport city center from 2003-2012.
------------------------------------------------------------------
My essay:
The line graph compares the number of cases between three different types of crime in Newport City center: burglary, car theft, and robbery from the year 2003 to 2012.
Overall, there was a difference in the ranking of burglary and car theft between 2003 and 2012 since the rate of burglary decreased significantly. However, the quantity of stolen cars and robbery incidents did not change.
In 2003, the cases of burglary were the highest, at around 3400 compared to the car theft (at about 2800), and the robbery (at 600 approximately).
The theft from the person incidents, despite being fluctuated during those nine years, ended up with the same figure as in 2003 in 2012. On the other hand, although the rate of burglary in Newport City center rose to nearly 3800 cases in 2004, it then went down steadily for four years later before remaining in the scope between about 1400 and 1500 from 2009 to 2012. Moreover, there there was the same pattern in the number of car being stolen between the first and last recorded years, standing at around 2700 after reaching its bottom at 2000 incidents in 2006 and surpassing the figure for burglary in the following years.
Top answer
The line graph compares the numbe r s of cases between t hree different types of crime in Newport City center: burglary, car theft, and robbery committed between from the year 2003 to and 2012. Overall, there was a [ 1] difference in the ranking of burglary and car theft between 2003 and 2012 since the rate of burglary decreased significantly. However, the quantity of stolen cars and robbery incidents did not change .
- The line graph compares the numbe r s of cases between t hree different types of crime in Newport City center: burglary, car theft, and robbery committed between from the year 2003 to and 2012.
- Overall, there was a [ 1] difference in the ranking of burglary and car theft between 2003 and 2012 since the rate of burglary decreased significantly.
- However, the quantity of stolen cars and robbery incidents did not change .
- [ 2] In 2003, the cases of burglary were the highest, at around 3 ,4 00 compared to the car thef t s (at about 2 ,8 00), and the robbe r ies (at 600 approximately).
- The theft from the person [ 3] incidents, despite [ 4] being fluctuated during those nine years, ended up with the same figure as in 2003 in 2012.
Get the Weekly English Kit 📬
New words, one handy idiom, and a 2-minute quiz — delivered to your inbox to keep your streak alive.
The line graph compares the numbers of cases between three different types of crime in Newport City center: burglary, car theft, and robbery committed between from the year 2003 to
Hà Tr?n 8023 being fluctuated
Please read my advice for Task 1 essays.
 Related Questions