
IELTS task 1. Please check my grammar
The charts below show the main reasons for study among students of different age groups and the amount of support they received from employers.
My essay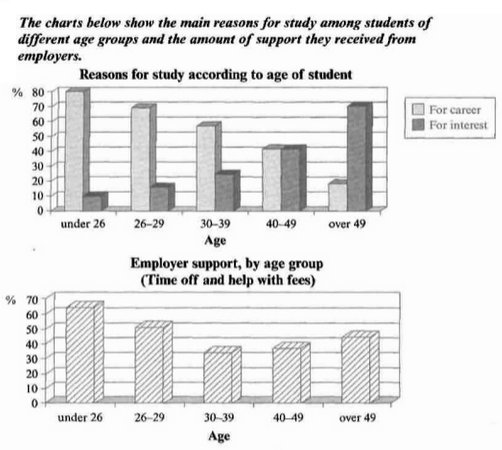
The bar charts give the percentages of two reasons, for career and interest, for study according to the age groups of students: under 26, 26-29, 30-39, 40-49 and over 49 and of support employees in different ages could receive from their employers.
Overall, under 26 students have the highest percentage of both study for their future career and employer support, while the reason for study is for enjoyment has the least proportion compared to other ages. Furthermore, employees in the age group of 30-39 see a decrease in the help from higher position.
In the first chart, there is the highest percentage of reason for work in the youngest age group, at 80%; however, they don’t have much interest in learning, as 8 times less than for career. On the other hand, students who are older than 49 share the highest proportion of enthusiasm in studying, at 70%, while for career reason doesn’t count as much as the previous one. Meanwhile, there is the same percentage in both reasons in the 40-49 group.
As for support, employers care about the youngest age group the most, but this trend starts to decline by the age of 39, from 70% to about 35% respectively. Nevertheless, after the officers reached the age of 40, people in higher position looked after them more carefully, yet not as much as the young, at from 40 to 45%.
Top answer
The bar charts give the percentages of two reasons , (That is not correct. ) receive from their employers. This infographic is way too complicated for one sentence.
- The bar charts give the percentages of two reasons , (That is not correct.
- ) receive from their employers.
- This infographic is way too complicated for one sentence.
- Make at least two sentences.
- Example opening: The first bar chart plots the results of a survey of students in five age groups asking them if they studied for personal interest or career advancement.
Get the Weekly English Kit 📬
New words, one handy idiom, and a 2-minute quiz — delivered to your inbox to keep your streak alive.
The bar charts give the percentages of two reasons, (That is not correct. Only one bar chart shows the reasons for study.) for career and interest, for study according to the age groups of students: under 26, 26-29, 30-39, 40-49 and over 49 and of support employees in different ages
 Related Questions