
IELTS Task 1 - Please check my essay [1P_01]
Task 1 - Pie chart - #01
The pie charts show the main reasons for migration to and from the UK in 2007.
Summarize the information by selecting and reporting the main features and make comparisons where relevant.
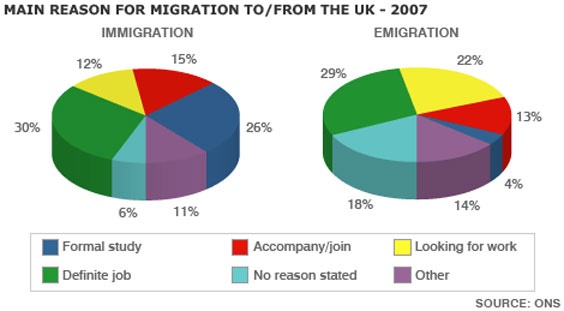
The two pie charts compare why people moved in and out of the United Kingdom in the year 2007, with six percentage-wise factors shown.
Overall, getting a definite job was the primary reason for migration. It is also apparent that formal study was the least influential in terms of emigration.
Look at the details, the proportions of people moving to and leaving the UK for employment reasons were relatively similar, at 30% and 29% in turn. Another leading factor for entering this country was to pursue education, with over a quarter, while only a minority (5%) emigrated for this.
Furthermore, there was a modest difference between the percentages of immigration and emigration caused by accompanying or joining a family, at 15% and 13%. Occupation seeking comprised 12% for the former, and 10% slightly more than that for the latter. Although over three in ten people chose other motives or did not state why they emigrated, these accounted for half of that (17%) regarding immigration.
Word count: 164 words
Please check this for me. Thank you.
Top answer
The two pie charts compare why people moved migrated in to and out of the United Kingdom in the year 2007, with six percentage-wise factors shown. Overall, getting a [ 1] definite job was the primary reason for migration. It is also apparent that formal study was the least influential in terms of emigration.
- The two pie charts compare why people moved migrated in to and out of the United Kingdom in the year 2007, with six percentage-wise factors shown.
- Overall, getting a [ 1] definite job was the primary reason for migration.
- It is also apparent that formal study was the least influential in terms of emigration.
- Look ing at the details, the proportions of people moving to and leaving the UK for employment reasons were relatively similar, at 30% and 29% in turn.
- Another leading factor (26%) for entering this migrating to that country was to pursue education, with over a quarter, while only a minority (5%) emigrated out of the UK for this that reason .
Get the Weekly English Kit 📬
New words, one handy idiom, and a 2-minute quiz — delivered to your inbox to keep your streak alive.
The two pie charts compare why people moved migrated into and out of the United Kingdom in the year 2007, with six percentage-wise factors shown.
Overall, getting a [ 1] definite job was the primary reason for migration. It is also apparent that formal stu
 Related Questions