
IELTS task 1 PLEASE CHECK MY ESSAY
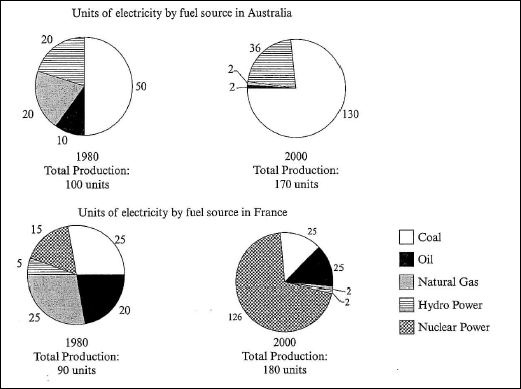
The pie charts below show units of electricity production by fuel source Australia and France in 1980 and 2000.
Summarise the information by selecting and reporting the main features, and make comparisons where relevant.
The pie charts compare the units of electricity by 5 fuel sources in Australia and France over two separate years.
There is an increase in the total electric production in both countries from 1980 to 2000. There were big differences in the fuel sources used.
The units of electricity produced by coal in Australia was 50 out of 100 units in 1980, and then significantly rose to 130 of the total 170 units in 2000. Meanwhile, in France, that remained at exactly 25 units of its electricity in 2000.
Nuclear was the most important source to produce electric in France, with 75% of the country’s electricity in 2000. The amount of electricity produced in France using this type of hydropower decreased from 5 to 2 units in 2000, whereas there was remarkably higher in Australia. On the other hand, oil remained a relatively important fuel source in France, but its use declined in Australia. Both countries produced less electricity by natural gas in 2000 than in 1980.
Get the Weekly English Kit 📬
New words, one handy idiom, and a 2-minute quiz — delivered to your inbox to keep your streak alive.
 Related Questions