
IELTS task 1 PLEASE CHECK MY ESSAY
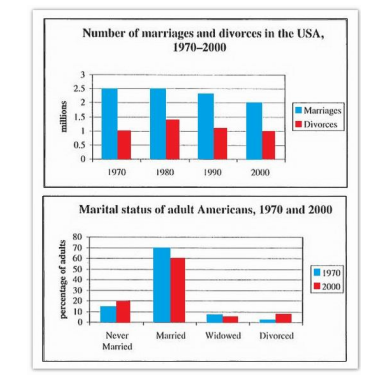
The first bar chart shows the number of marriages and divorces between 1970 and 2000 in the USA. The second chart gives the marital status of adult Americans in 1970 and 2000.
There was an increase in the number of marriages from 1970 to 2000. The major of Americans adults were married in both years. The number of single adults was higher than in other categories in 2000.
In 1970, the rate of marriages was stood at 2.5 million, whereas that of divorces was exactly 1 million. From 1970 to 2000, the marriage rate remained stable in 1980, and then slightly decreased by 0.5 million, ending at 2 million in 2000. Meanwhile, the divorces reached a peak at nearly 1.5 in 1980, before falling to its starting value at the end of the period.
Around 70% of Americans adults were married in 1970, but decreased by over 10 percentage points in 2000, at under 60%. In 2000, the rate of unmarried people and divorces rose by 10% in total. The proportion of widowed Americans was dropped from about 7% in 1970 to 5% in 2000
Top answer
The first bar chart shows the number of marriages and divorces every ten years between 1970 and 2000 in the USA in millions . The second chart gives the marital status the percentage of adult Americans in each of four marital status categories in 1970 and 2000. The four categories are: Never married, Married, Widowed and Divorced.
- The first bar chart shows the number of marriages and divorces every ten years between 1970 and 2000 in the USA in millions .
- The second chart gives the marital status the percentage of adult Americans in each of four marital status categories in 1970 and 2000.
- The four categories are: Never married, Married, Widowed and Divorced.
- ) There was an increase in the number of marriages from 1970 to 2000.
- The major (wrong word) of Americans adults were married at the start and end of the period.
Get the Weekly English Kit 📬
New words, one handy idiom, and a 2-minute quiz — delivered to your inbox to keep your streak alive.
The first bar chart shows the number of marriages and divorces every ten years between 1970 and 2000 in the USA in millions. The second chart gives the marital status the percentage of adult Americans
 Related Questions