
IELTS task 1 PLEASE CHECK MY ESSAY
The chart below shows the total number of minutes ( in billions) of telephone calls in the UK divided into three categories, from 1995 – 2002.
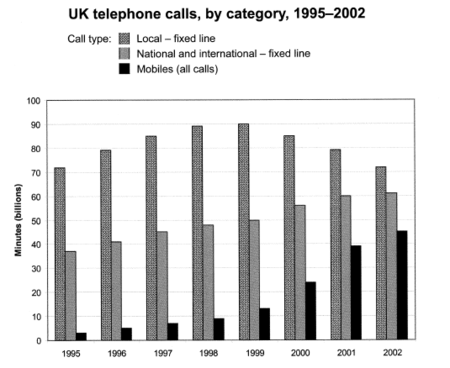
The bar chart gives how much time people spent on their calls altogether in the UK, divided into 3 call type: Local, national and international – fixed line, mobiles ( all calls) between 1995 and 2002. The units of measurement are billion minutes.
The amounts spent on local calls were higher than in other categories. There was an increase in the number of minutes of national and international and mobiles calls during this time.
In 1995, people in the UK spent slightly over 7o on local calls, while those spent about half as much on national and international calls, at nearly 40. In the same time, the numbers spent on mobiles calls started at about 4, the lowest value in the data set.
From 1996 to 2001, there was a gradual increase in the amounts spent on local calls, reached a peak at exactly 90 in 1999, before decreasing by roughly 20 to its starting value, at barely more than 70. The amounts spent on national and international calls had a mild evaluation until it peaked at slightly over 60 in 2002, narrowing the gap with local calls. People also spent more time on mobile calls, which rapidly rose 9-fold, at approximately 45 at the end of the period.
Top answer
The bar chart gives how much time people spent on phone calls altogether in the UK, divided into three 3 call type s: Local, national and international – fixed line, (missing word) mobiles ( all calls) between 1995 and 2002. The units of measurement are billion minutes . (wrong expression) The amount of time spent on local calls was consistently higher than in other categories.
- The bar chart gives how much time people spent on phone calls altogether in the UK, divided into three 3 call type s: Local, national and international – fixed line, (missing word) mobiles ( all calls) between 1995 and 2002.
- The units of measurement are billion minutes .
- (wrong expression) The amount of time spent on local calls was consistently higher than in other categories.
- There was an increase in the number of minutes of national and international and mobiles calls during this time.
- In 1995, people in the UK spent slightly over 7o on local calls, while those they spent about half as much time on national and international calls, at about 38 nearly 40 .
Get the Weekly English Kit 📬
New words, one handy idiom, and a 2-minute quiz — delivered to your inbox to keep your streak alive.
The bar chart gives how much time people spent on phone calls altogether in the UK, divided into three 3 call types: Local, national and international – fixed line, (missing word) mobiles ( all calls) between 1995 and 2002. The units of m
 Related Questions