
IELTS task 1 PLEASE CHECK MY ESSAY
The chart below shows the percentage of households in owned and rented accommodation in England and Wales between 1918 and 2011.
Summarise the information by selecting and reporting the main features, and make comparisons where relevant.
The bar chart shows the percentage of households owning and renting accommodation in England and Wales from 1918 to 2011.
Overall, t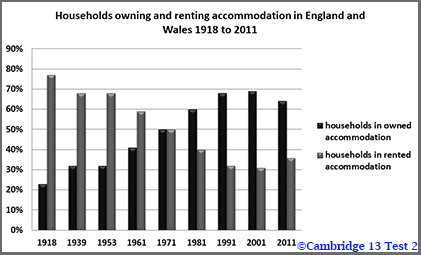
here was a gradual increase in the percentage of households in owned during this time, whereas the figures for renting accommodation had a dramatic decrease between 1918 and 2011.
The proportion of households owning and renting accommodation followed an opposite trend throughout the period. In 1918, nearly 80% of people had houses, the highest value in the set data. In contrast, the percentage of renting accommodation started at a quarter of that amount, about 20%, the lowest value on the chart.
From 1939 to 2001, the figures for households owning rose roughly 3- fold, peaked at roughly 70% in 2001, before falling to 65% approximately in 2011. Meanwhile, there was a constant decline by about 45 percentage points in that of renting accommodation, reached a trough at nearly 30% in 2001, and then slightly went up to roughly 45% at the end of the period.
Top answer
The bar chart shows the percentages of households owning and renting accommodation in England and Wales from 1918 to 2011. Nine points in time are plotted: 1918, 1939, 1953 and then every 10 years from 1961 to 2011. ) decrease between 1918 and 2011.
- The bar chart shows the percentages of households owning and renting accommodation in England and Wales from 1918 to 2011.
- Nine points in time are plotted: 1918, 1939, 1953 and then every 10 years from 1961 to 2011.
- ) decrease between 1918 and 2011.
- I gave you this advice in your previous post.
- Apparently, you did not read it.
Get the Weekly English Kit 📬
New words, one handy idiom, and a 2-minute quiz — delivered to your inbox to keep your streak alive.
The bar chart shows the percentages of households owning and renting accommodation in England and Wales from 1918 to 2011. Nine points in time are plotted: 1918, 1939, 1953 and then every 10 years from 1961 to 2011.
Overall, there was a gradual increase in the percentage of households in owned
 Related Questions