
IELTS task 1 PLEASE CHECK MY ESSAY
The graph below gives information about car ownership in Britain from 1971 to 2007.
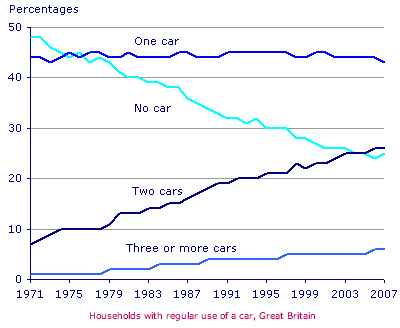
The line graph shows information about car ownership ( one car, no car, two cars, and three or more cars by households in Britain between 1971 and 2007. The units of measurement are percentages.
Overall, car ownership increased over the period shown. The percentages of households with two cars and three or more cars rose, whereas that of no car had a dramatic decrease during this time.
The proportion of households with no car started at about 47 in 1971, the highest value in date set, and had a significant fall about 50% in 2003, at 25, and then remained this point until 2007. While, the two-car households stood at roughly 7 in 1971 and gradually went up by 20 respectively in 2003, narrowing the gap between the amounts of two cars and no car, before increasing to about 26 in 2007.
Meanwhile, the one-car households started at nearly 45, it remained a narrow range, from this point until 2007. The number of households with three or more cars started at about 1 in 1971, the lowest value on the graph, and had a 5-fold increase from the remainder of the period, at approximately 5.
Top answer
The line graph shows the percentage of British households who own a certain number of cars information about car ownership ( one car, no car, two cars, and three or more cars) by households in Britain between 1971 and 2007. The units of measurement are percentages. Overall, car ownership increased over the period shown.
- The line graph shows the percentage of British households who own a certain number of cars information about car ownership ( one car, no car, two cars, and three or more cars) by households in Britain between 1971 and 2007.
- The units of measurement are percentages.
- Overall, car ownership increased over the period shown.
- The percentages of households with two cars and three or more cars rose, whereas those without any car that of no car had a significant dramatic decrease during this time.
- The percentage with one car varied within a narrow range.
Get the Weekly English Kit 📬
New words, one handy idiom, and a 2-minute quiz — delivered to your inbox to keep your streak alive.
The line graph shows the percentage of British households who own a certain number of cars information about car ownership ( one car, no car, two cars, and three or more cars) by households in Britain between 1971 and 2007. The units of measurement are percentages.
Overall, car ownership increased over the period
 Related Questions