
IELTS task 1 PLEASE CHECK MY ESSAY
The graph below shows the consumption of fish and some different kinds of meat in a European country between 1979 and 2004.
Summarise the information by selecting and reporting the main features, and make comparisons where relevant
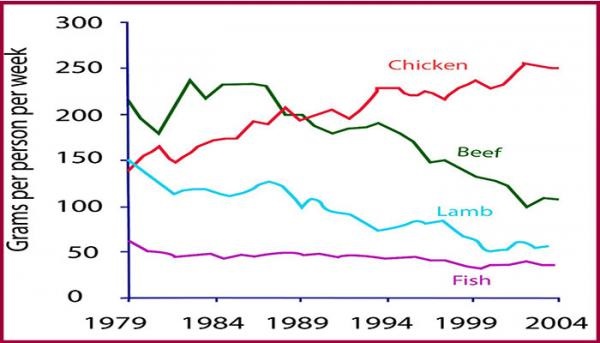
The graph illustrates the consumption of fish and some different kinds of meat in a European country during the 25 years from 1979 to 2004.
Overall, the amount of beef, lamb, and fish had a dramatic decrease throughout this period, whereas chicken had a fluctuating increase. Fish was the least commonly used food in the European country during this time.
Strikingly, there was a negative correlation between chicken and beef which were consumed. The figure for beef started at about 220 grams per person per week, it was the highest value in the set data in 1979, but then significant fell about 50 %, at about 100 grams in 2004. In contrast, standing at nearly 150 grams in 1979 and dramatic rose, surpassing consumption of beef in 1989, and ended at about 250 grams in 2004.
Meanwhile, the consumption of lamb and fish followed a similar trend throughout the period. The amount of Fish started at exactly 150 grams and then declined nearly a half in the remainder of the period, narrowing the gap between fish and lamb, at about 75 grams. Simultaneously, the last figure had a slight drop from over 50 to roughly 40 grams in 2004, becoming the lowest value.
Top answer
The line graph illustrates plots/gives/ shows the consumption of fish and three different kinds of meat (Beef, Lamb and Chicken) in a European country during the 25 years from 1979 to 2004. The units of measurement are grams per person per week. Illustrate means to make a drawing or picture.
- The line graph illustrates plots/gives/ shows the consumption of fish and three different kinds of meat (Beef, Lamb and Chicken) in a European country during the 25 years from 1979 to 2004.
- The units of measurement are grams per person per week.
- Illustrate means to make a drawing or picture.
- It is fine for a map, or other type of drawing which has a picture of different features.
- For Task 1, make a list of all the different noun phrases in the instructions and figure.
Get the Weekly English Kit 📬
New words, one handy idiom, and a 2-minute quiz — delivered to your inbox to keep your streak alive.
The line graph illustrates plots/gives/ shows the consumption of fish and three different kinds of meat (Beef, Lamb and Chicken) in a European country during the 25 years from 1
 Related Questions