
IELTS TASK 1: PIE CHART (Household expenditure in Japan and Malaysia)
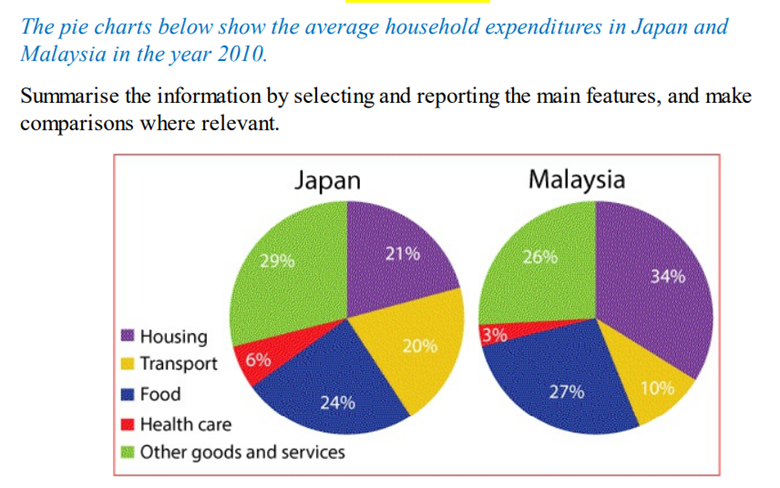
The pie charts compare the average spending in Japanese and Malaysian households in terms of five categories in 2010. those five categories are housing, transportation, health care, food as well as goods and services.
In general, Japanese and Malaysian families spent the largest proportion of their money on three categories, namely housing, transport, and food. Health care was the least spent category in both countries.
While Japanese people spent most of their income on goods and services, with 29% of the total expenditure, this figure was only 26% in Malaysia. Conversely, housing accounted for the largest proportion of expenditure in Malaysia, at around 34% which is higher compared to 21% in Japan. The proportion of expenditure on food was relatively similar for both nations, with 27% for Malaysia and 24% for Japan. In Malaysia, people spent 3% and 10% of their household budget on health care and transport respectively. These figures were exactly doubled in Japan, which were 6% for health care and 20% for transportation.
Top answer
I already gave you considerable feedback on this essay. Why did you post it a second time? You have to scroll down to the last entry on the trhread.
- I already gave you considerable feedback on this essay.
- Why did you post it a second time?
- You have to scroll down to the last entry on the trhread.
- htm
Get the Weekly English Kit 📬
New words, one handy idiom, and a 2-minute quiz — delivered to your inbox to keep your streak alive.
I already gave you considerable feedback on this essay. Why did you post it a second time? You have to scroll down to the last entry on the trhread.
https://www.englishforums.com/English/TaskChartBelowGivesInformation-
 Related Questions