
IELTS TASK 1: Pie chart (Energy capacity in the future)
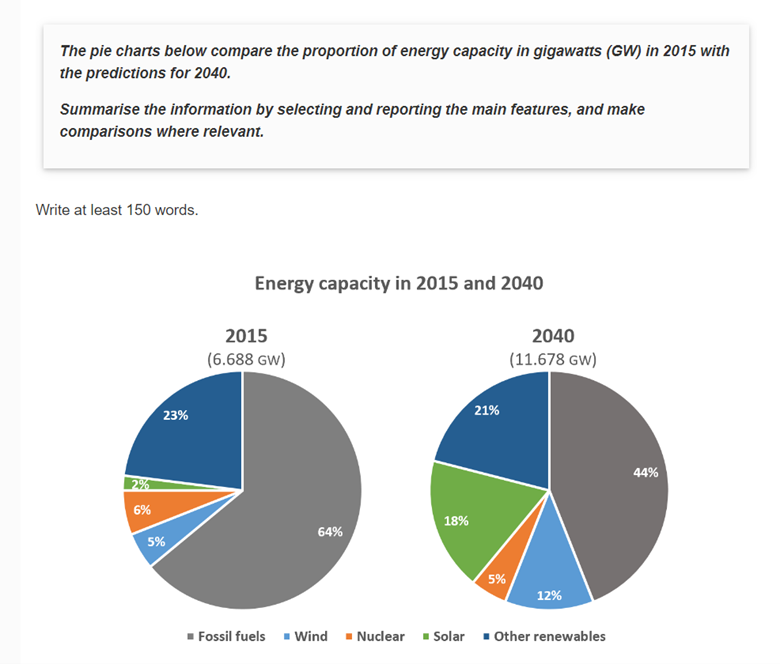
The pie charts show the expected changes in energy capacity in 2040 compared to 2015. The charts break down energy capacity into 5 different categories that are fossil fuels, wind power, nuclear energy, solar energy, and other renewables.
Overall, the total annual gross capacity of energy will nearly double from 6.688 GW to 11.678 GW. Energy capacity is predicted to diversify in 2040, with the proportion of renewable energy types rising at the expense of non-renewable ones.
In detail, of all eight different types of energy, one will fall sharply in proportion, two will have a substantial increase, and two will stay roughly the same. In 2015, fossil fuels, which accounted for over half of the proportion of energy used, is projected to decrease by a third in 2040. Solar energy comprised 2% and will have a ninefold increase in proportion by the year 2040. Likewise, wind power is forecasted to markedly rise from 5% in 2015 to 12% in 2040. Nuclear energy and other renewables will remain relatively the same at around 21% to 23% and 5% to 6%, respectively.
Top answer
The pie charts show the expected changes in energy capacity in 2040 compared to 2015. The charts break down E nergy capacity is broken down into 5 different categorie s, that are fossil fuels, wind power, nuclear energy, solar energy, and other renewables. 678 GW.
- The pie charts show the expected changes in energy capacity in 2040 compared to 2015.
- The charts break down E nergy capacity is broken down into 5 different categorie s, that are fossil fuels, wind power, nuclear energy, solar energy, and other renewables.
- 678 GW.
- Energy capacity is predicted to diversify (wrong word.
- Diversify relates to the number of categories.
Get the Weekly English Kit 📬
New words, one handy idiom, and a 2-minute quiz — delivered to your inbox to keep your streak alive.
The pie charts show the expected changes in energy capacity in 2040 compared to 2015. The charts break down Energy capacity is broken down into 5 different categories, that are fossil fuels, wind power, nuclear energy, solar energy, and other renewables.
 Related Questions