
IELTS Task 1 - Pie Chart
Please help me review this writing, thanks in advance!
The charts show the responses of a group of students in a survey conducted by their university library. The survey aims to measure how happy these students are with the IT support and the current opening hours of the library.
Regarding the former, almost the same percentage of full-time and part-time students were quite happy (32% and 35% respectively). However, more than a half of full-time students said they were very happy while just one-fifth of part-time students had the same opinion. The percentage of unsatisfied people, therefore, greatly differed (13% for full-time students and 45% for part-time students).
In terms of the latter, the proportions of very satisfied students are significantly high in both groups. More than two-thirds of full-time students and nearly three-quarters of part-time students were very happy. Meanwhile, only a minority of them stated being not happy at all (just 5% or less).
Overall, it can be seen that both groups of students demonstrated a high level of satisfaction with the opening hours. However, a much greater percenta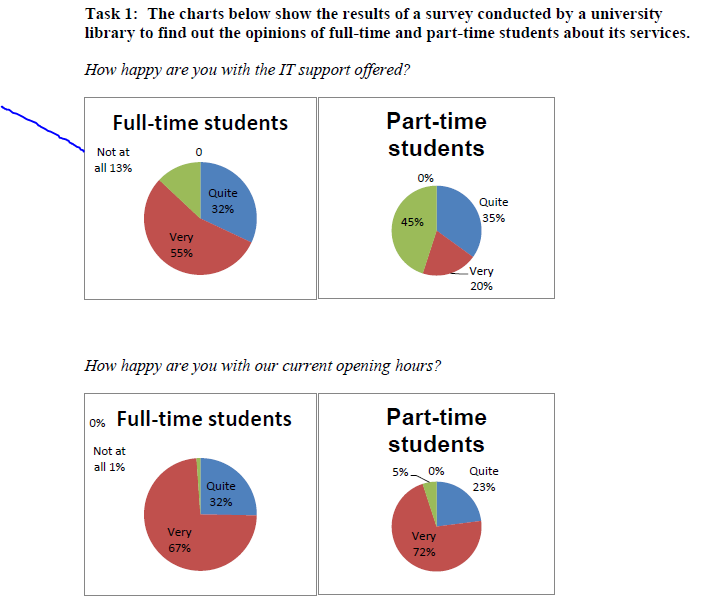
ge of full-time students were happy with the IT assistance, compared to the case of their counterparts.
Top answer
The (How many charts are there? What does each one show? Are they bar charts?
- The (How many charts are there?
- What does each one show?
- Are they bar charts?
- ) charts show the responses of a group of students in a survey conducted by their university library.
- The survey aims to measure how happy these students are with the IT support and the current opening hours of the library.
Get the Weekly English Kit 📬
New words, one handy idiom, and a 2-minute quiz — delivered to your inbox to keep your streak alive.
The (How many charts are there? What does each one show? Are they bar charts? If so, what are the units of measurement?) charts show the responses of a group of students in a survey conducted by their university library. The survey aims to measure how happy these students are with the IT support and the current opening hours of the library. (What could students select from on the sur
 Related Questions