
IELTS TASK 1 - PIE CHART
The charts below show the result of surveys in 2005 and 2009 asking workers about their relationships with their supervisors and their co-workers.
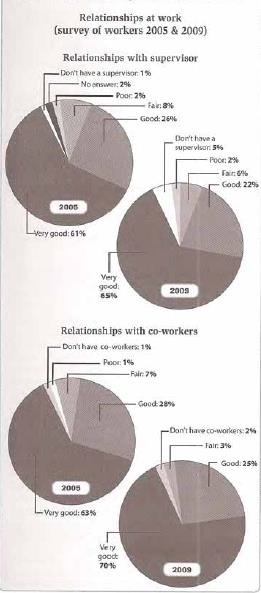
The four pie charts illustrate how workers felt about their relationships with their bosses and their co-operators in two different years (2005 & 2009).
Overall, almost employees have close relationships with their supervisors and their co-workers. However, the level of extreme satisfaction was high throughout the four-year period, while the percentage of people saying relationships were good enough fell a bit.
In 2005, plenty of workers said that they have a very good relationship between them and their employers, accounted for 61% in total. This was followed by a slight increase after 4 years (65% in 2009). The proportion of people worked in companies without leaders was 1% in 2005, and increased five-time in 2009. Also, the rating of workers felt their relationships with bosses boring remained constant during this period (2% for each year).
The levels of people had an extremely close relationship with their colleagues, which comprised nearly a three-quarter of relationships with co-workers, at 63%, continued to increase to 70%. In contrast, the percentage of workers thought their relationships between them and their co-operators were good or could be acceptable were at 28% and 7% in 2005, respectively, and decreased by 3% and 4% in each order after a 4-year period.
THANK YOU SO MUCH FOR HELPING ME TO CHECK THIS SUMMARIZE.
Top answer
The four pie charts illustrate how workers felt about their relationships with their bosses and their co-operators in two different year s, 2005 and 200 9 . Overall, (1) almost all employees have (2) close positive relationships with their supervisors and their co-workers. However, while the level proportion of those who were very extreme satisfaction satisfied was high throughout the four-year period, while the percentage of people employees saying relationships were just good enough fell slightly .
- The four pie charts illustrate how workers felt about their relationships with their bosses and their co-operators in two different year s, 2005 and 200 9 .
- Overall, (1) almost all employees have (2) close positive relationships with their supervisors and their co-workers.
- However, while the level proportion of those who were very extreme satisfaction satisfied was high throughout the four-year period, while the percentage of people employees saying relationships were just good enough fell slightly .
- (3) a bit.
- In 2005, plenty of workers (61% in total) said that they have there was a very good relationship between them and their employer s.
Get the Weekly English Kit 📬
New words, one handy idiom, and a 2-minute quiz — delivered to your inbox to keep your streak alive.
The four pie charts illustrate how workers felt about their relationships with their bosses and their co-operators in two different years, 2005 and 2009.
Overall, (1)almost all employees have
 Related Questions