
IELTS TASK 1 - PIE CHART
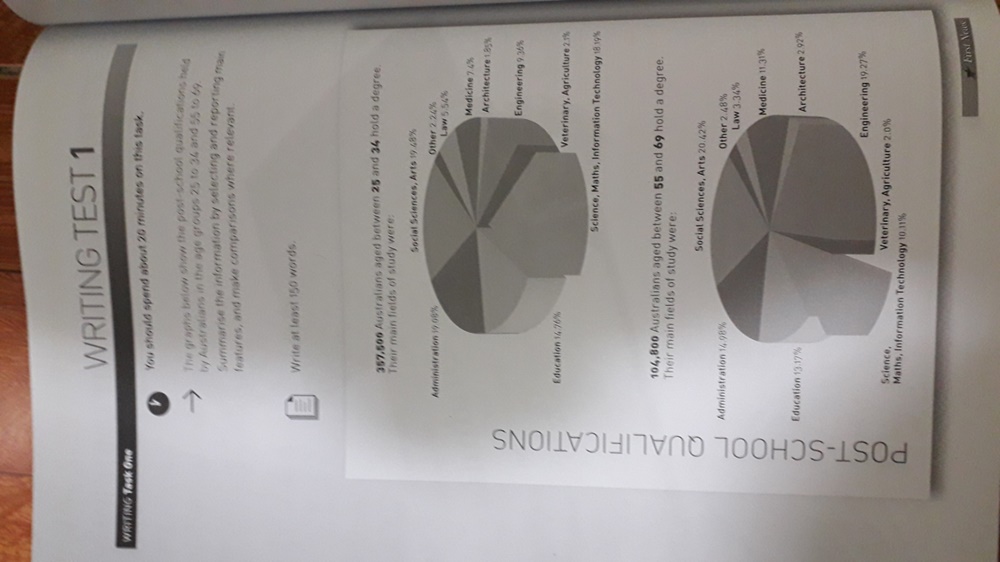
These two pie charts compare the differences between the two groups of Australians (25 to 34 and 55 to 69 year olds) in terms of their post-school qualifications.
The first point to note is the huge increase in the number of people with qualifications. The younger group is more than three times bigger than the older group (347,500 compared to 104,800).
Comparing the two groups, architecture and medicine have experienced a decrease in popularity with younger graduates; medicine declined by nearly 4%. However, the biggest loss was to engineering, which decreased from 19,27% to 9,35% of the whole.
Some subjects were more popular with the younger age group. The biggest gains in graduate numbers were made by Science, Maths and IT which, as a group, have risen by over 8%. Administration has gained by 4,1%.
Overall, the charts illustrate a threefold increase in the number of graduates. The most noticeable change in subject percentages is the fall in the number of engineering graduates.
Top answer
These two pie charts show compare the differences between the two groups of Australians (25 to 34 and 55 to 69 year olds) in terms of their post-school qualifications. Model paragraph: These two pie charts permit / allow the comparison of differences between two groups of Australians (25 to 34 and 55 to 69 year olds) in terms of their post-school qualifications. Their qualifications, which means holding a degree, are grouped into ten categories, for example, Administration, Education, Science, Social Sciences, Engineering and Medicine.
- These two pie charts show compare the differences between the two groups of Australians (25 to 34 and 55 to 69 year olds) in terms of their post-school qualifications.
- Model paragraph: These two pie charts permit / allow the comparison of differences between two groups of Australians (25 to 34 and 55 to 69 year olds) in terms of their post-school qualifications.
- Their qualifications, which means holding a degree, are grouped into ten categories, for example, Administration, Education, Science, Social Sciences, Engineering and Medicine.
- The first point to note is the huge significant increase in the number of people with qualifications.
- The younger group is more than three times larger bigger than the older group (347,500 compared to 104,800).
Get the Weekly English Kit 📬
New words, one handy idiom, and a 2-minute quiz — delivered to your inbox to keep your streak alive.
These two pie charts show compare the differences between the two groups of Australians (25 to 34 and 55 to 69 year olds) in terms of their post-school qualifications.
Model paragraph:
These two pie charts permit / allow the comparison of differences between two groups of Australians (25 to 34 and 55 to
 Related Questions