
IELTS TASK 1: Pie chart
The pie charts illustrate the amount of water consumed in 2 regions in America and other parts of the world for 3 purposes, namely agricultural, industrial and residential purposes.
Looking at the graph, it is clear that farming registers the highest water consumption in San Diego and California. By contrast, the most significant amount of water used in the rest of the world is recorded for domestic purposes.
In San Diego, residential use accounts for the majority of water consumption at 60%. Meanwhile, agriculture only makes up a meager proportion at 17%. An opposite allocation is seen in the rest of the world, where household and farming purposes account for 69 and 8% respectively. The figure for industrial use of water is the same for both these regions at 23%.
Such significant discrepancies are not seen in water consumption in California. In particular, the amount of water consumed for farming and industry constitutes roughly the same proportion at 39 and 33% respectively. The figure for residential use is only slightly lower at 28% of total water consumption.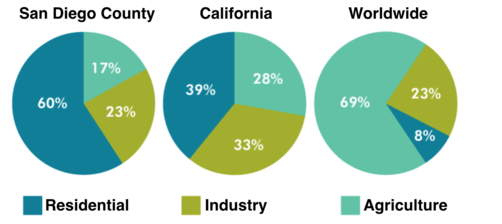
Top answer
The pie charts illustrate the amount of wate r (The charts do not show amounts of water. An amount would be a value like 2 million litres. ) purposes, namely agricultural, industrial and residential purposes.
- The pie charts illustrate the amount of wate r (The charts do not show amounts of water.
- An amount would be a value like 2 million litres.
- ) purposes, namely agricultural, industrial and residential purposes.
- ) Looking at the graph, it is clear that (See prior feedback why you should not write those words in Task 1) farming (Wrong word.
- ) registers has the highest water consumption in San Diego (Missing word) and California.
Get the Weekly English Kit 📬
New words, one handy idiom, and a 2-minute quiz — delivered to your inbox to keep your streak alive.
The pie charts illustrate the amount of water (The charts do not show amounts of water. An amount would be a value like 2 million litres. ) consumed in 2 regions in America and other parts of the world globally for 3
 Related Questions