
IELTS TASK 1 - PIE CHART
I'm preparing for IELTS exam next month and I answered 2 questions in task 1. Could any one help me check them please?
1.
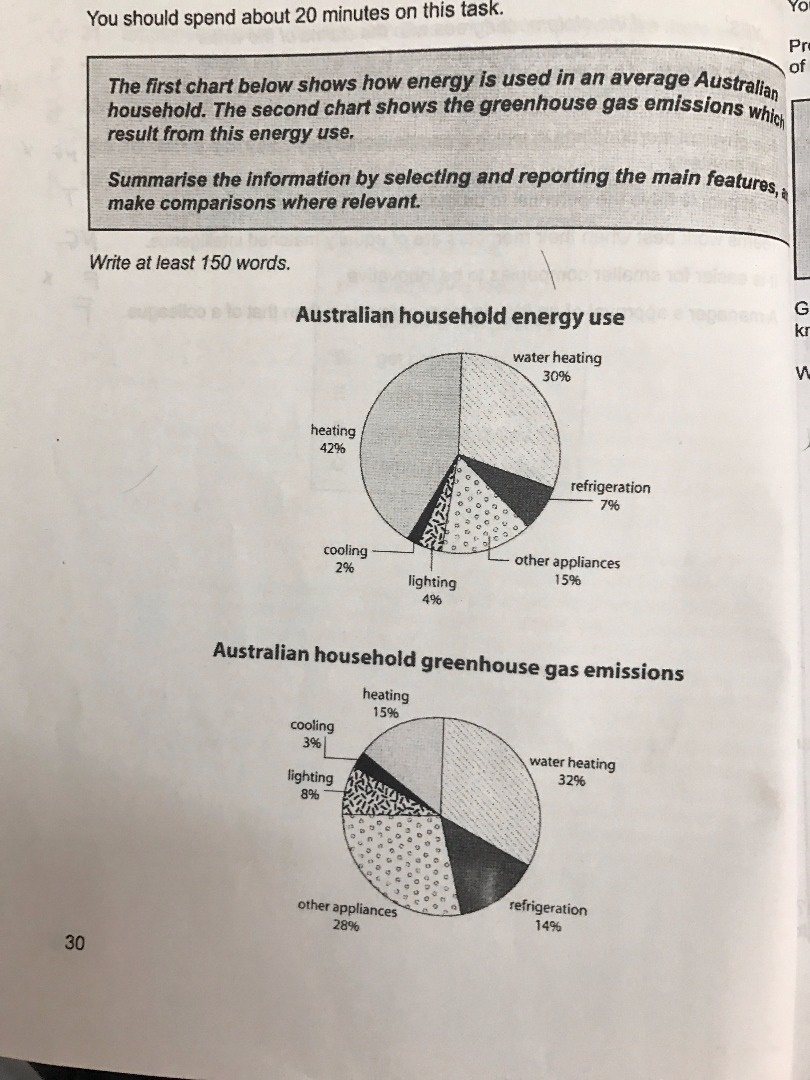
The first chart compares the percentage of energy consumed for particular purposes in Australian household. The second chart shows the share of greenhouse gas emissions for which each energy use accounted.
It is clear that heating and water heating in Australian household consume the most energy. In addition, water heating and using other appliances are the two main sources of greenhouse gas emissions.
Heating is the most energy-consuming activity in an average household, accounting for 42% of the total energy, while the percentage of energy used by water heating is 12% lower, at 30%. Meanwhile, the share of energy used for cooling (2%) is similar to that for lighting (4%). Furthermore, other appliances consume 15% of total energy , whereas only 7% of energy consumption is for regrigeration operation.
Water heating and the use of other appliances make up the greatest percentage of greenhouse gas emissions, at 32% and 28% respectively. In contrast, lighting produces only 8% of the total amount of greenhouse gases, compared to a mere 3% for cooling. At the same time, the emissions of greenhouse gases released from using refrigeration and heating are almost the same, comprising about 15% of total emissions.
(196 words)
The alternative:
The two charts give information about Australian household energy use and greenhouse gas emissions from that energy use.
It is clear that most energy is consumed for heating and water heating. Additionally, water heating is the main source of greenhouse gas emissions.
In terms of how energy is used, the percentage of energy provided for heating is highest, at 42%, while the figure for water heating is slightly lower, at 30%. Other appliances consume 15% of total energy, whereas 7% of household energy consumption is for refrigeration. Meanwhile, cooling and lighting account for the smallest shares of the total amount of energy, at 2% and 4%, respectively.
Regarding to greenhouse gas emissions, water heating generates the largest share of greenhouse gases (32%), while 28% of the emissions is released from the use of other appliances. Heating and refrigeration produce a similar percentage of the emissions, at around 15%. Meanwhile, cooling and lighting make up only 2% and 4% of the total emissions respectively.
(163 words)
Top answer
The first chart compares the shows a breakdown by percentage of energy consumed for particular purposes in Australian household. The second chart shows the share of relative amounts of greenhouse gas emissions per usage. for which each energy use accounted .
- The first chart compares the shows a breakdown by percentage of energy consumed for particular purposes in Australian household.
- The second chart shows the share of relative amounts of greenhouse gas emissions per usage.
- for which each energy use accounted .
- It is clear that H eating and water heating in Australian household consume the most energy, accounting for almost 75% of the total.
- In addition, But heating is not a major source of greenhouse gas emissions.
Get the Weekly English Kit 📬
New words, one handy idiom, and a 2-minute quiz — delivered to your inbox to keep your streak alive.
The first chart compares the shows a breakdown by percentage of energy consumed for particular purposes in Australian household. The second chart shows the share of relative amounts of greenhouse gas emissions per usage. for which each energy use accounted.
It is clear that Heating and water heating in Australian hou
The pie charts compare the mean proportion of energy use in six different items and production of green house gases caused by the use these energies in the Australia.
Overall, all the household things produces more percentage of unwanted gases compared to their consumption of energy except heating. It is also worth mentioning that heating and water heating uses most energy w
 Related Questions