
Ielts task 1: Pie
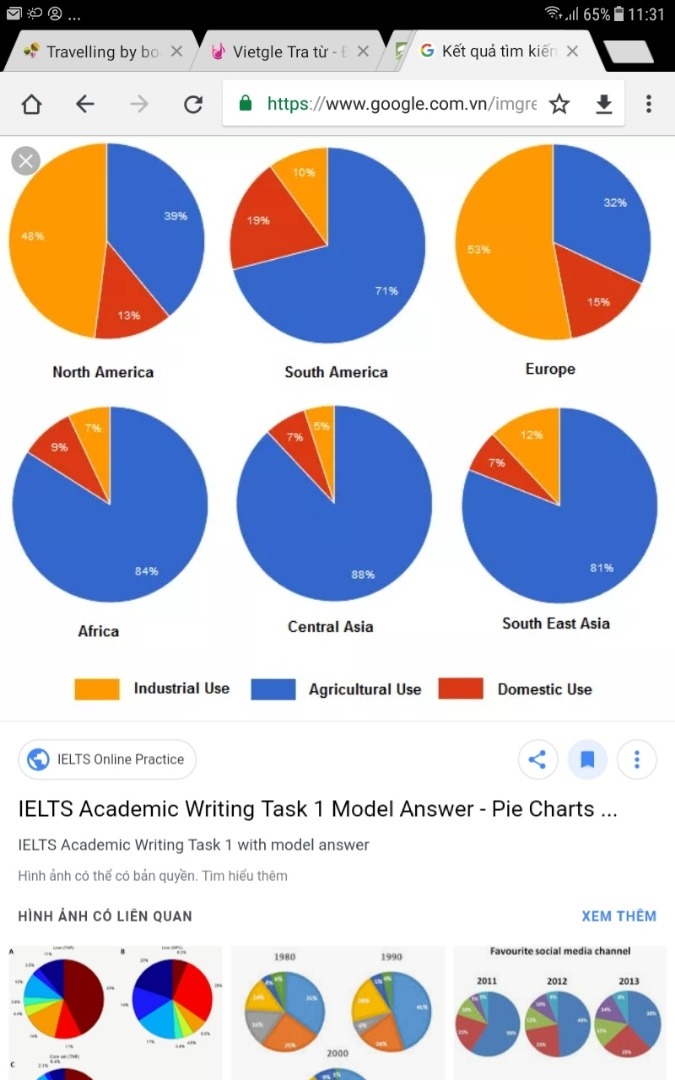
The pie charts compare the proportion of water usage for industrial, agricutural and household purposes in six regions worldwide.
Overall, Southamerica, Africa and many countries in Asia consume the most substantial percentage of water for agriculture, whereas the greatest proportion of water is used for industry in Northamerica and Europe.
As can be seen from the charts, over 80% of water used for agriculture in Africa, Centralasia and Southeast Asia, followed by Southamerica, with the figure being slightly lower, just over 70%. In contrast, a higher percentage of water consumed for industry in Northamerica and Europw than the other nations, at around 50%. In Southamerica, Africa, Centralasia and Southeast Asia, water is used for industry ranging from 5% to 12%. Centralasia and Southeast Asia share the similar proportion of water for household use, at 7%, roughly half figure of Europe and Northamerica. The largest percentage of water for domestic use is recorded in Southamerica, at nearly 20%, which is twice as high as that in Africa.
Top answer
The pie charts compare the proportion of water usage for industrial, agricutural and household purposes in six regions worldwide. (What are the regions? ) consume the most substantial percentage of water for agriculture, whereas the greatest proportion of water is used for industry in Northamerica and Europe.
- The pie charts compare the proportion of water usage for industrial, agricutural and household purposes in six regions worldwide.
- (What are the regions?
- ) consume the most substantial percentage of water for agriculture, whereas the greatest proportion of water is used for industry in Northamerica and Europe.
- As can be seen from the charts , (That clause is not needed.
- The reader knows you are describing the charts.
Get the Weekly English Kit 📬
New words, one handy idiom, and a 2-minute quiz — delivered to your inbox to keep your streak alive.
The pie charts compare the proportion of water usage for industrial, agricutural and household purposes in six regions worldwide. (What are the regions? Tell the reader in the first paragraph.)
Overall, Southamerica, Africa and many countries i
 Related Questions