
IELTS TASK 1 OVERSEAS VISITORS
Hi this is my writing task 1, thanks for your review in advance. Would you mind focusing on evaluating my word choice, task performance, grammar, coherence, and cohesion?
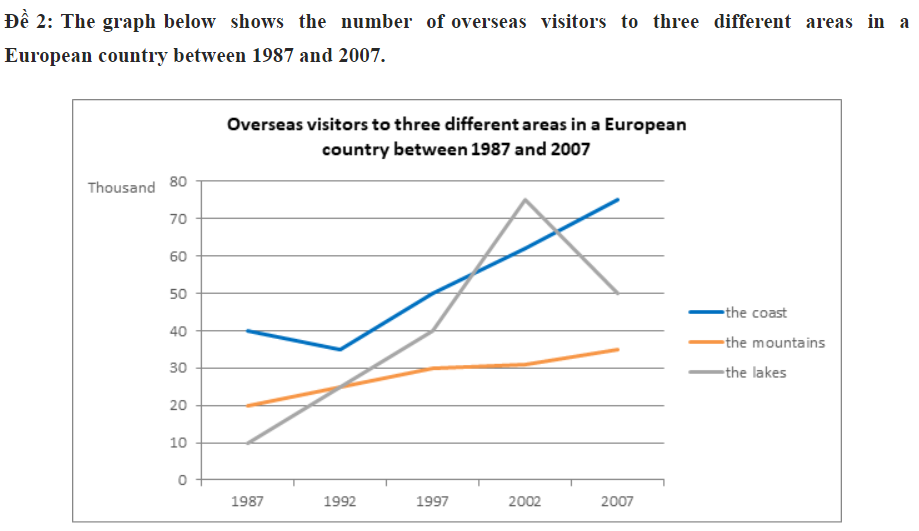
The line graph illustrates how many foreigners visited three separate regions in a European nation from 1987 to 2007.
It can be seen from the graph that there was a similar upward trend in the coast and the mountain's visitors while the figure for the lake's visitors experienced a contrasting movement over the given period.
In 1987, 20 thousand tourists of the mountain whereas 40 thousand visitors for the coast. The number of overseas visitors travelled to the mountain rose slightly by 30 thousand in 1977, then continued its upward trend less gradually to 36 thousand tourists in 2007. Beside that, the coast witnessed a slight decreased in the quantity of visitors by a few thousand but later increased considerably to around 51 thousand visitors in 1977. Which was followed by a noticeable a rise to 75 thousand tourists in 2007.
In more detail, from 1987 to 1997 there was a significant increase of 40 thousand foreign travelers who impressed on the lakes, which was followed by a substantial a rise 75 thousand visitors until 2002. But later, decreased remarkably at 50 thousand travelers in 2007.
Top answer
The line graph illustrates how many foreigners visited three separate regions in a European nation from 1987 to 2007. [ 1 ] It can be seen from the graph that T here was [ 2 ] a similar an upward trend in the graphs for the coast and the mountai ns, visitors while the figure for the lake's visitors experienced a contrasting movement over the given substantial rise before dropping slightly in the latter part of that period. In 1987, 20 thousand tourists of visited the mountai n s, whereas 40 thousand visitors for double that number went to the coast.
- The line graph illustrates how many foreigners visited three separate regions in a European nation from 1987 to 2007.
- [ 1 ] It can be seen from the graph that T here was [ 2 ] a similar an upward trend in the graphs for the coast and the mountai ns, visitors while the figure for the lake's visitors experienced a contrasting movement over the given substantial rise before dropping slightly in the latter part of that period.
- In 1987, 20 thousand tourists of visited the mountai n s, whereas 40 thousand visitors for double that number went to the coast.
- The number of overseas visitors travelled to for the mountain s rose slightly by steadily and reached 30 thousand in 1977, then it plateaued but started rising again in 2002 and continued its upward trend less gradually to reached 36 thousand tourists in 2007.
- Beside that, On the other hand, visitor numbers to the coast witnessed a slight decreased in the first five years, from 40 thousand to about 35 thousand, but then the figure increased substantially for the remaining years to end at quantity of visitors by a few thousand but later increased considerably to around 51 thousand visitors in [ 3 ] 1977.
Get the Weekly English Kit 📬
New words, one handy idiom, and a 2-minute quiz — delivered to your inbox to keep your streak alive.
The line graph illustrates how many foreigners visited three separate regions in a European nation from 1987 to 2007.
[ 1] It can be seen from the graph that There was [ 2] a similar an upward trend in the graphs f
 Related Questions