
IELTS- TASK 1: Men and women smoking cigarettes in Australia
Question: The line chart below shows the number of men and women that smoke cigarettes in Australia.
Answer:
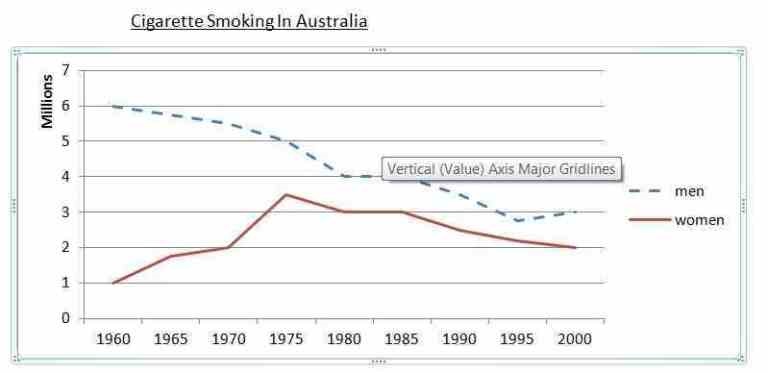
The graph illustrates the quantity of male and female smokers in Australia from 1960 to 2000. Overall, the number of men smoking cigarettes decreased dramatically whereas there was a slight rise in woman smokers in the whole period. In addition, the number of the men was always higher than that of the women at each same year.
For the figure of men smoking cigarettes, there were about 6 million male smokers in 1960, and it fell significantly to 4 million in 1980. Between 1980 and 1995, the number of males decreased slightly and reached a low of 2.8 million. By 2000, there was a little upward trend of 3 million men.
For female smokers, the quantity of females increased rapidly by about 2.5 million from 1960 to 1975, and peaked at 3.5 million in 1975. However, it dropped gradually to 2 million between 1975 and 2000 with the decreasing rate at about 0.3 million female smokers per 5 years.
[159 words]
Top answer
) graph illustrates (wrong word) the quantity (wrong word) of male and female smokers in Australia from 1960 to 2000. Overall, the number of men smoking cigarettes decreased dramatically whereas there was a slight rise in woman smokers in the whole period. In addition, the number of the men was always higher than that of the women at each same year.
- ) graph illustrates (wrong word) the quantity (wrong word) of male and female smokers in Australia from 1960 to 2000.
- Overall, the number of men smoking cigarettes decreased dramatically whereas there was a slight rise in woman smokers in the whole period.
- In addition, the number of the men was always higher than that of the women at each same year.
- Overall, the number of men smoking cigarettes decreased dramatically whereas there was a slight rise in woman smokers in the whole period.
- In addition, the number of the men was always higher than that of the women at in each same year.
Get the Weekly English Kit 📬
New words, one handy idiom, and a 2-minute quiz — delivered to your inbox to keep your streak alive.
The (What kind of graph?) graph illustrates (wrong word) the quantity (wrong word) of male and female smokers in Australia from 1960 to 2000. Overall, the number of men smoking cigarettes decreased dramatically whereas there was a slight rise in woman smokers in the whole pe
 Related Questions