
Ielts Task 1 - Line Graph: crime in Panama City
The chart below shows the changes that took place in three different areas of crime in Panama City from 2010 to 2019.
My writing:
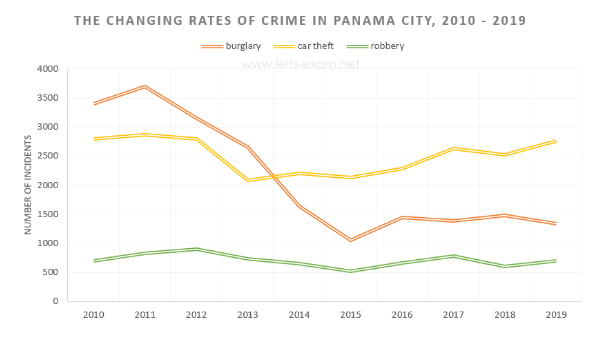
The line graph gives information about the number of three kinds of crimes that took place in Panama City between 2010 and 2019.
Overall, the total crime incident in 2019 was lower than it has been in 2010. The burglary had a significant drop in criminal cases while robbery remained as least incidents area in the entire time span.
In 2010, burglary had the highest number of crime incidents at about 3400 cases. In contrast, robbery had the lowest figure at just approximately 600 incidents, while the criminal case of car theft was much higher at about 2700 incidents.
From 2010 to 2012, the number of car theft remained consistently unchanged, before sharply fell to the lowest point at around 2000 cases in 2013. In the remaining period, this number gradually increase to about 2600 in 2019. Although increased to the highest point at about 3700 in 2011, burglary cases then significantly dropped to the lowest point at 1000 in 2015. In the remaining period, this number varied and ended at about 1400 cases by the year 2019. The number of robberies varied in a range from 500 to 1000 and remained as the lowest number among all areas in the period shown.
Please take a look and give me any comment. Thank you so much
Get the Weekly English Kit 📬
New words, one handy idiom, and a 2-minute quiz — delivered to your inbox to keep your streak alive.
 Related Questions