
IELTS Task 1 (Line graph)
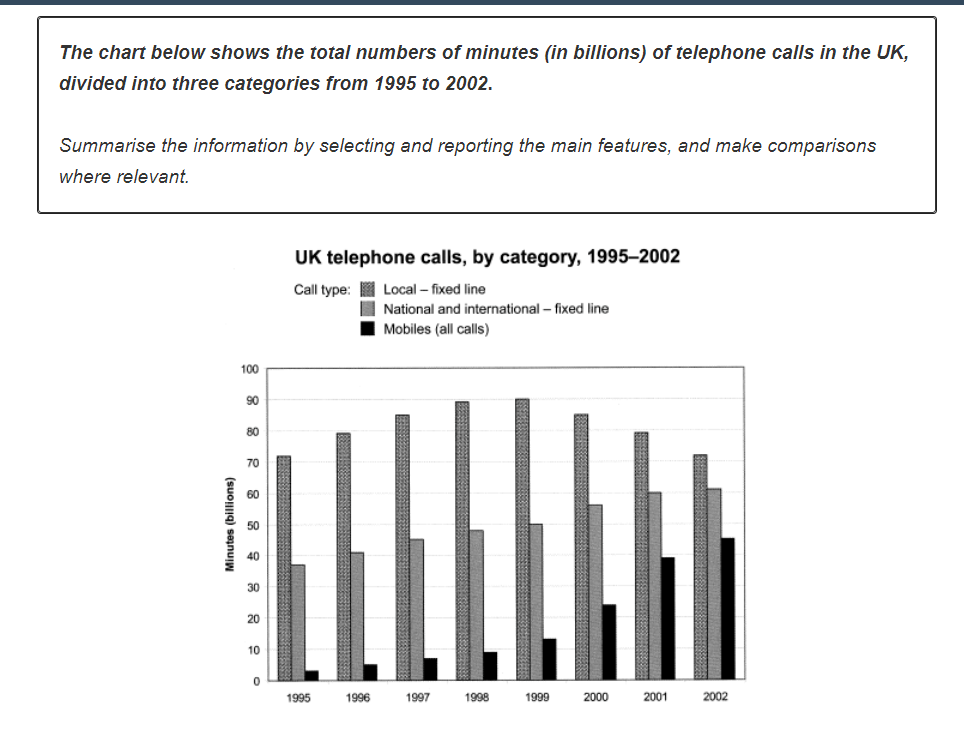
The chart shows the total number of minutes in billionsof telephone calls in UK, divided into three categories: local - fixed line; national and international - fixed line; mobiles - between 1995 and 2002.
Over the period, call types have different changes. However, they always in a same situation, which local-fixed line had the greatest number while mobiles was at the least.
National and international - fixed line; mobiles have similar trend: growing steadily. In 1995, mobiles cited at under 5 billions minutes of calling and then went up to a very approximately 45 billions minutes in 2002, which grew 900%. On the other hand, national and international - fixed line had nearly 40 billions minutes calling in 1995 and over 60 billion minutes in 2002. Through years, this category showed the higher number than its first search, in 1995, just nearly 150%.
Among three categories, local - fixed line had the highest amount of calling minutes. Meanwhile, it was on a different trend from others. Local - fixed line grew steadily and its peak was in 1999, at 90 billion minutes. After the year of 1999, this category followed a decrease trend and result in a fail to about 70 billion minutes in 2002.
Top answer
) chart shows the total number of minutes in billionsof telephone calls (That is not good. It is not plotting billions of telephone calls. ) in UK, divided into three categories: local - fixed line; national and international - fixed line; mobiles - between (The punctuation is incorrect.
- ) chart shows the total number of minutes in billionsof telephone calls (That is not good.
- It is not plotting billions of telephone calls.
- ) in UK, divided into three categories: local - fixed line; national and international - fixed line; mobiles - between (The punctuation is incorrect.
- It makes your sentence inaccurate) 1995 and 2002.
- Over the period, call types have different changes .
Get the Weekly English Kit 📬
New words, one handy idiom, and a 2-minute quiz — delivered to your inbox to keep your streak alive.
The (What kind of chart is this?) chart shows the total number of minutes in billionsof telephone calls (That is not good. It is not plotting billions of telephone calls. ) in UK, divided into three categories: local - fixed line; national and international - fixed line; mobiles - between
 Related Questions