
IELTS TASK 1: Line graph
The charts below shows the number of meals eaten in fast food restaurants and sit-down restaurants.
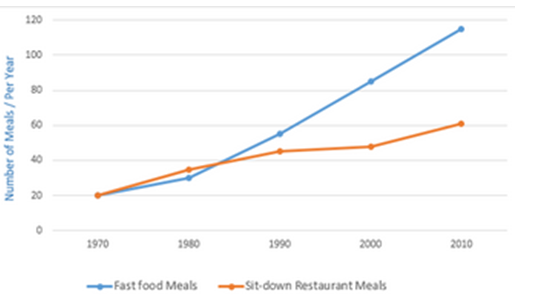
The line graph compares number of meals served in fast food and sit-down restaurant over a period of 40 years starting from 1970.
As can be seen from the graph, it is evident that there is a general upward trednd in number of meals had in both types of restaurant. People preferred having a meal in fast food restaurants to eating at sit-down restaurants.
At the beginning, there was 20 meals eaten in fast food restaurant, which was also the same number to meals eaten in sit-down restaurant. During the period, the amount of fast food meals increased in a steady rate from 20 to nearly 120 meals per year.
We can see the similar trend in the change in number of meals taken in sit-down restaurants but in a slower pace. In 1980, it was reported that there were 30 meals per year, a bit higher than that of fast food restaurant. However, until the end of the period, the number showed a slight rise of 30 from 30 meals to 60 meals a year, which was only the half of number of fast food meals.
Top answer
The instructions are incomplete. There should be some pie charts with the line graph. com/writing-sample/academic-writing-task-1/117-food-budget-the-average-australian-family-spent-on-restaurant
- The instructions are incomplete.
- There should be some pie charts with the line graph.
- com/writing-sample/academic-writing-task-1/117-food-budget-the-average-australian-family-spent-on-restaurant
Get the Weekly English Kit 📬
New words, one handy idiom, and a 2-minute quiz — delivered to your inbox to keep your streak alive.
The instructions are incomplete. There should be some pie charts with the line graph.
 Related Questions