
IELTS TASK 1: Line graph
The graph below shows the proportion of the population aged 65 and over between 1940 and 2040 in three different countries.
Summarise the information by selecting and reporting the main features, and make comparisons where relevant.
Write at least 150 words.
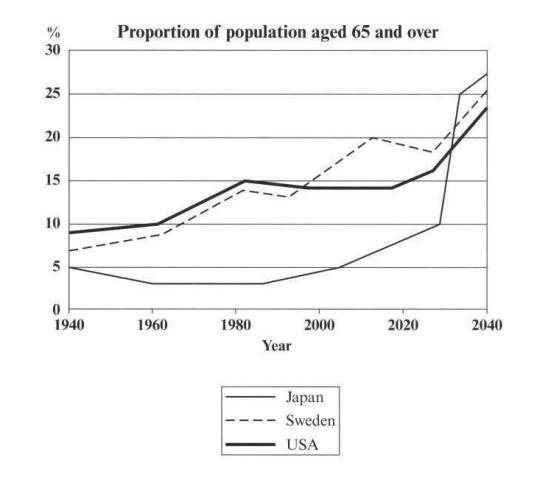
The line graph demonstrates the percentage of senior people in three countries from three different continents namely Japan, Sweden and the USA over a course of a century starting from 1940 to 2040.
According to the graph above, it is obvious that all the three countries have witnessed an upward trend in the population of elderly. The senior population in Japan is predicted to be the highest out of the three countries in the future.
At the beginning, proportion of senior people in the USA accounted for nearly 10 percent in 1940. Between 1940 and 2020, the number has gradually rose to 15 percent. It is forecast to climb to 24 percent in 2040.
Similarly, the same trend of increase in number of the elderly can be seen in Sweden. The figure stood at around 6 percent in 1940 and then will jump over three times higher by 2020. By the end of the graph’s time frame, population of older people in this country is expected to reach 25 percent.
By contrast, at the 45-year- initial period of the time frame starting from 1940, percentage of the senior population in Japan underwent a slight decrease from 5 downto 2.5 percent in 1985, which was also marked as the lowest point of the whole graph. From 1985 to 2030, the senior population has gone up to 10 percent. Afterwards, the number will increase quite rapidly and reach a peak at 28 percent in 2040, which will be higher than the two remained countries.
Top answer
yirapyirap The line graph demonstrates 'Demonstrates' in this context roughly means 'proves', so is inappropriate. t2%3B%2Cgraph%20below%20%2A_VERB%3B%2Cc0%3B%2Cs0%3B%3Bgraph%20below%20shows_VERB%3B%2Cc0%3B%3Bgraph%20below%20is_VERB%3B%2Cc0%3B%3Bgraph%20below%20represents_VERB%3B%2Cc0%3B%3Bgraph%20below%20illustrates_VERB%3B%2Cc0%3B%3Bgraph%20below%20indicates_VERB%3B%2Cc0%3B%3Bgraph%20below%20gives_VERB%3B%2Cc0%3B%3Bgraph%20below%20compares_VERB%3B%2Cc0%3B%3Bgraph%20below%20depicts_VERB%3B%2Cc0%3B%3Bgraph%20below%20showing_VERB%3B%2Cc0%3B%3Bgraph%20below%20summarizes_VERB%3B%2Cc0 Word count : 252. I would question whether there is time in an IELTS exam to write this much, given that Task 2 is worth two-thirds of the marks.
- yirapyirap The line graph demonstrates 'Demonstrates' in this context roughly means 'proves', so is inappropriate.
- t2%3B%2Cgraph%20below%20%2A_VERB%3B%2Cc0%3B%2Cs0%3B%3Bgraph%20below%20shows_VERB%3B%2Cc0%3B%3Bgraph%20below%20is_VERB%3B%2Cc0%3B%3Bgraph%20below%20represents_VERB%3B%2Cc0%3B%3Bgraph%20below%20illustrates_VERB%3B%2Cc0%3B%3Bgraph%20below%20indicates_VERB%3B%2Cc0%3B%3Bgraph%20below%20gives_VERB%3B%2Cc0%3B%3Bgraph%20below%20compares_VERB%3B%2Cc0%3B%3Bgraph%20below%20depicts_VERB%3B%2Cc0%3B%3Bgraph%20below%20showing_VERB%3B%2Cc0%3B%3Bgraph%20below%20summarizes_VERB%3B%2Cc0 Word count : 252.
- I would question whether there is time in an IELTS exam to write this much, given that Task 2 is worth two-thirds of the marks.
- com/dictionary/senior-citizen 'Senior' might mean over-60, over 65, or over pension age, whatever that is, and so is inaccurate.
- There is no penalty for repeating labels from the diagram, provided the phrase is three words or less.
Get the Weekly English Kit 📬
New words, one handy idiom, and a 2-minute quiz — delivered to your inbox to keep your streak alive.
yirapyirapThe line graph demonstrates
'Demonstrates' in this context roughly means 'proves', so is inappropriate.
The line graph demonstrates (wrong word) the percentage of senior (wrong word, unless you define it first. ) people in three countries from three different continents namely, Japan, Sweden and the
 Related Questions