
IELTS task 1 - line graph.
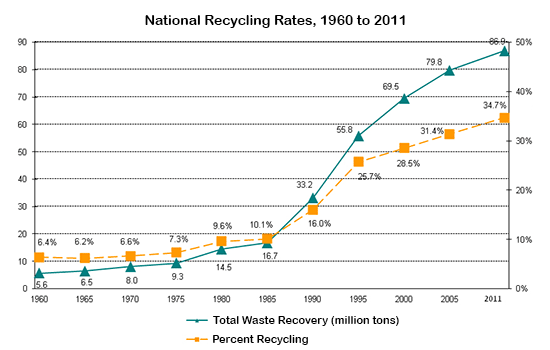
The graph below shows waste recycling rates in the U.S. from 1960 to 2011.
Summarise the information by selecting and reporting the main features, and make comparisons where relevant.
Answer :
The line chart provides information about the percentage of recycling in the U.S between 1960 to 2011.
Overall, there was an upward trend in Total Waste Recovery and Percent Recycling over the period shown. However, it is clear that recycling suddenly changed from 1985 to 2011 and had no sign of decreasing during the period.
In 1960, the quantity of trash which was recycled accounted for 5.6 million tons, followed by a minimum growth to 8 million tons in 1970. By 1985, the total waste recovery was just under 17 million and stayed at 16.7 million tons in 1985. Similarly, Percent Recycling saw a slight rise with beginning at 6.4% in 1960, going up to 7.3% and 10.1% in 1975 and 1985 respectively.
In contrast, from 1985 onward, that period witnessed a dramatic growth. The total waste recovery reached 33.2 million tons in 1990, which was double as high as it had been in 1985. That continuously climbed to 69.5% in 2000 and peaked at 86.9% in 2011. Meanwhile, the proportion of recycling considerably augmented to 28.5% in 2000 and finished at 34.7% in 2011.
Top answer
S between 1960 to (wrong word) 2011. In particular, it show two indicators of recycling, the percentage of goods recycled and the tonnage of waste recovery. Overall, there was an upward trend in Total Waste Recovery and Percent Recycling over the period shown.
- S between 1960 to (wrong word) 2011.
- In particular, it show two indicators of recycling, the percentage of goods recycled and the tonnage of waste recovery.
- Overall, there was an upward trend in Total Waste Recovery and Percent Recycling over the period shown.
- However, it is clear that the trend rate for both indicators of recycling suddenly changed in from 1985 ; they went up.
- to 2011 and had no sign of decreasing during the period.
Get the Weekly English Kit 📬
New words, one handy idiom, and a 2-minute quiz — delivered to your inbox to keep your streak alive.
The line chart (wrong word) provides information about the percentage of recycling in the U.S between 1960 to (wrong word) 2011. In particular, it show two indicators of recycling, the percentage of goods recycled and the tonnage of waste recove
The graph gives information on the proportion of the national recycled waste product by the Americans from 1960 to 2011.
Overall, the total waste recovered and the percentage of it that was recycled had an increasing trend over a 51-year period.
There was a a stable increased seen in number of the total recovered waste products in the US from 1960 to 2011. In fact, in the first giv
 Related Questions