
IELTS TASK 1: Line chart (Wheat Exports)
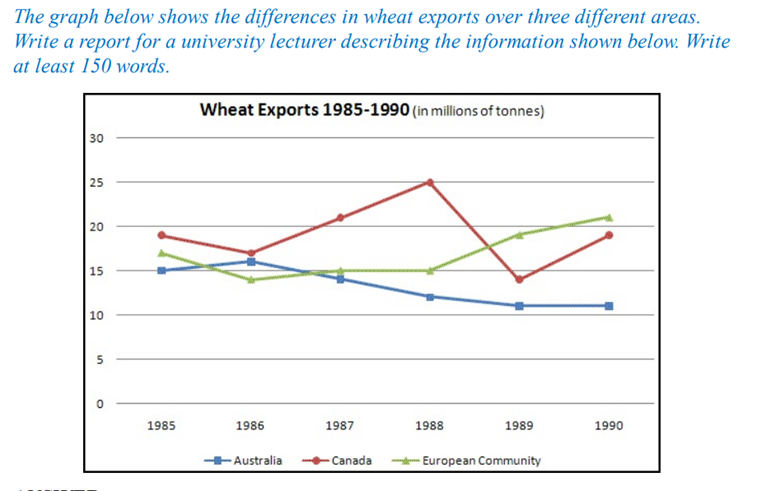
The graph shows the wheat exports of three separate regions from 1985 to 1990. The three regions are Australia, Canada, and Europe.
Overall, Australia had a decrease in the total of exported wheat, whereas there was a general increase in wheat exports in Europe. Additionally, although there were some variations in the amount of wheat exported, wheat exports remained relatively the same in Canada.
Australia’s wheat export figure started at 15 million tons in 1985 and subsequently rose to about 16 million tons in 1986. Afterward, there was a linear decline in the total of exported wheat from around 16 million in 1986 to approximately 11 million tons in 1990. By contrast, The European Community exported around 17 million tons of wheat in 1985. Then, the total of exported wheat dropped to about 14 million tons in 1986, hitting a plateau at around 15 million tons over the next 2 years. There was an upward increase in wheat exports over a three-year span, rising to just above 20 million tons in 1990. In addition, Canadians shipped approximately 19 million tons of wheat in 1985, which decreased to 17 million tons in 1986. Between 1986 to 1988, the figure showed a linear upward trend, reaching a peak at exactly 25 million tons in 1988. The figure then plummeted to only around 14 million tons in 1989. This number then quickly rose to 19 million by the next year.
(I know that the report is too long and I need to reduce the word count. So, I would like to hear some advice on how to shorten the report without changing too much of its content. Also, tips to improve on this type of graph would be nice.)
Top answer
The graph shows plots / compares / shows the wheat exports of three separate regions from 1985 to 1990. The three regions are Australia, Canada, and the Europe an Community from 1985 to 1990. (Note the decrease in word count with more precise information.
- The graph shows plots / compares / shows the wheat exports of three separate regions from 1985 to 1990.
- The three regions are Australia, Canada, and the Europe an Community from 1985 to 1990.
- (Note the decrease in word count with more precise information.
- 22 to 17 words) Overall, Australia had a decrease in the total of exported wheat, whereas there was a general increase in wheat exports in Europe.
- Additionally, although there were some variations in the amount of wheat exported, wheat exports remained relatively the same in Canada .
Get the Weekly English Kit 📬
New words, one handy idiom, and a 2-minute quiz — delivered to your inbox to keep your streak alive.
The graph shows plots / compares / shows the wheat exports of three separate regions from 1985 to 1990. The three regions are Australia, Canada, and the European Community from 1985 to 1990. (Note the decrease in word count with m
 Related Questions