
IELTS TASK 1: Horizontal bar chart (Population growth of cities over the years)
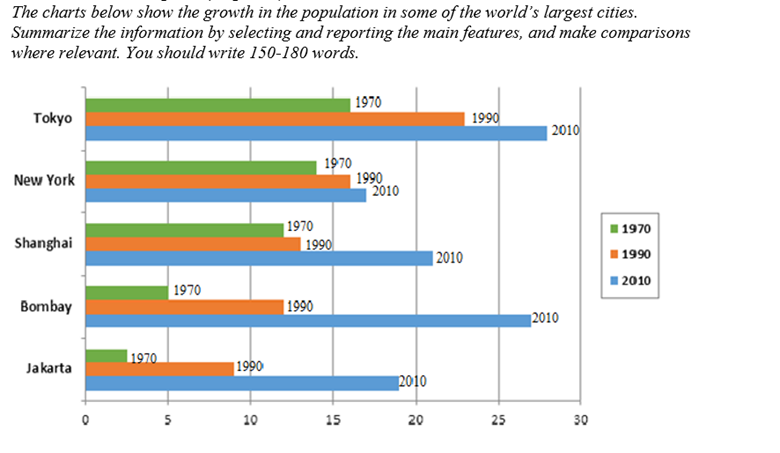
The horizontal bar chart plots the population growth of five metropolitan areas from 1970 to 2010. Those areas are Tokyo, New York, Shanghai, Bombay, and Jakarta.
Overall, there was a general upward trend in the number of people living in those cities. While Jakarta and Bombay had the fastest population growth rate of all the five cities, the population growth in New York was the slowest compared to other cities.
In 1970, more than 15 million people lived in Tokyo 1970, the highest among the five cities. The population in Jakarta at that time was 2.5 million people, which was the smallest when compared with that of other cities. Bombay had around one-third of Tokyo’s population, at precisely 5 million people. In 2010, the population of Tokyo increased to about 27 million people, remaining the highest out of the five cities. Furthermore, the population growth of Jakarta and Bombay, which was over 5 times by 2010, was higher than that of any other cities listed. Notably, New York, which had the second-highest number of residents with around 14 million people in 1970, became the city with the smallest population in 2010.
Top answer
The horizontal bar chart plots the population growth of five cities in 1970, 1990 and 2010, showing how much they grew . metropolitan areas (A metropolitan area is not the same as a city - it covers a much larger area. Do not attempt to use synonyms for a math/science task.
- The horizontal bar chart plots the population growth of five cities in 1970, 1990 and 2010, showing how much they grew .
- metropolitan areas (A metropolitan area is not the same as a city - it covers a much larger area.
- Do not attempt to use synonyms for a math/science task.
- ) from 1970 to 2010 .
- Those areas They are Tokyo, New York, Shanghai, Bombay, and Jakarta.
Get the Weekly English Kit 📬
New words, one handy idiom, and a 2-minute quiz — delivered to your inbox to keep your streak alive.
The horizontal bar chart plots the population growth of five cities in 1970, 1990 and 2010, showing how much they grew. metropolitan areas (A metropolitan area is not the same as a city - it covers a much larger area. Do not attempt to use synonyms for a math/science task. They do not mean the same thing.)
 Related Questions