
IELTS TASK 1 - Help me to correct it!!!
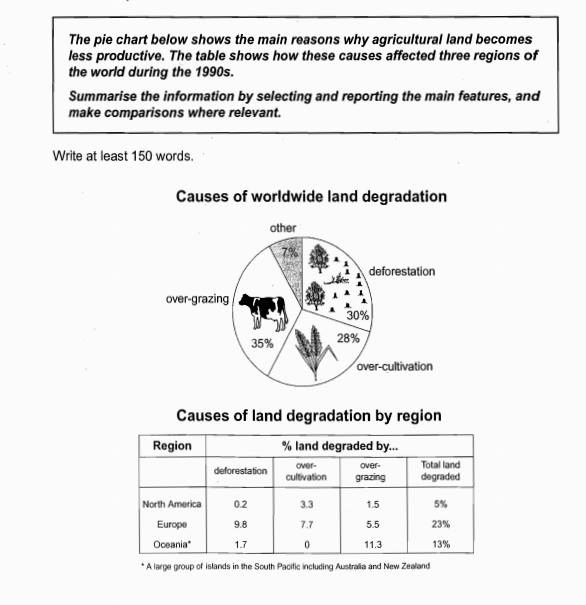
The pie chart below compares four different factors causing worldwide land degradation while the given table illustrates the percentage of land degraded by various elements in three areas, namely: North America, Oceania, and Europe.
Overall, most land becomes less productive because of over-grazing and Europe is the place which had the highest amount of land degraded.
Looking at the pie graph in more detail, over-grazing was the most common reason of land deterioration, at 35% which was 5% higher than deforestation. The lowest figure belonged to other reasons, at 7% which was four times lower than over-grazing.
Regarding the table, Europe ranked first in the place of total land degraded, at nearly a quarter of land and the main cause was deforestation, at 9,8%. On the other hand, Oceania was the only area which had no land degraded by over-cultivation while the figure for North America and Europe were 3,3% and 7,7% respectively.
Top answer
The pie chart below compares four different factors causing worldwide land degradatio n, while the given table illustrates the percentage of land degraded by various elements in three areas, namely: North America, Oceania, and Europe. Overall, most land becomes became less productive because of over-grazin g, and Europe is the place region which had the highest amount largest area of land degraded. Looking at the pie chart graph in more detail, over-grazing was the most common reason of for land deterioratio n.
- The pie chart below compares four different factors causing worldwide land degradatio n, while the given table illustrates the percentage of land degraded by various elements in three areas, namely: North America, Oceania, and Europe.
- Overall, most land becomes became less productive because of over-grazin g, and Europe is the place region which had the highest amount largest area of land degraded.
- Looking at the pie chart graph in more detail, over-grazing was the most common reason of for land deterioratio n.
- In fact at it was responsible for 35% of global land degradation, which was 5% higher than the area degraded by deforestation.
- On the other hand, over-cultivation accounted for 28% of all degraded land, while 7% was due to other factors.
Get the Weekly English Kit 📬
New words, one handy idiom, and a 2-minute quiz — delivered to your inbox to keep your streak alive.
The pie chart below compares four different factors causing worldwide land degradation, while the given table illustrates the percentage of land degraded by various elements in three areas, namely: North America, Oceania, and Europe.
Overall, most land becomes became less productive b
https://ielts-simon.com/ielts-help-and-english-pr/2019/05/ielts-writing-task-1-stop-using-given.html
car banana 513The pie chart below compares four different factors causing worldwide land degradation while the given table illustrates the
 Related Questions