
IELTS Task 1 Essay
Hi
Please check my IELTS Task 1 essay.
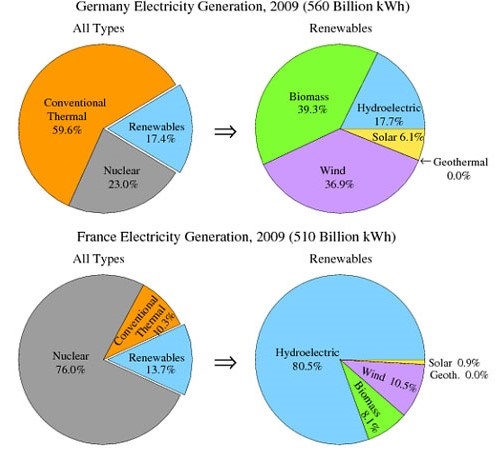
The pie charts show the sources, both renewable and non-renewable, from which Germany and France generated electricity in 2009.
Overall, while Germany relied more on Thermal energy, France fulfilled a significant percentage of its electricity needs using nuclear power. There was no significant difference in the percentages of renewable energy sources used by both of them.
In detail, while Germany generated around 60% of its electricity using thermal energy, thermal energy had only a little over 10% share in the overall distribution in France. Further, France used nuclear power to generate around three-fourths of its electricity needs, but nuclear energy in Germany had only a little over 20% share in all. As for renewable energy sources, with close to 40% overall share, Biomass was the leading contributor in Germany, whereas in France, with an 80% overall share, hydroelectric energy had a significant lead over the others. Additionally, solar energy whose contribution was a little over 6% in Germany was less than 1% in France.
Top answer
The first paragraph is inadequate to describe the figure. The two main pie charts, one for France and one for Germany, break down the power sources used for the production of electricity in 2009 into three sectors, conventional thermal, nuclear and renewables. The renewables sector is further broken down in two additional pie charts.
- The first paragraph is inadequate to describe the figure.
- The two main pie charts, one for France and one for Germany, break down the power sources used for the production of electricity in 2009 into three sectors, conventional thermal, nuclear and renewables.
- The renewables sector is further broken down in two additional pie charts.
- The types of renewable energy shown are biomass, wind, hydroelectric, geothermal and solar.
Get the Weekly English Kit 📬
New words, one handy idiom, and a 2-minute quiz — delivered to your inbox to keep your streak alive.
The first paragraph is inadequate to describe the figure.
The two main pie charts, one for France and one for Germany, break down the power sources used for the production of electricity in 2009 into three sectors, conventional thermal, nuclear and renewables. The renewables sector is further broken down in two additional pie charts. The types of renewable energy shown are biomass,
 Related Questions