
IELTS Task 1 Essay
Hi
Please check this essay for me.
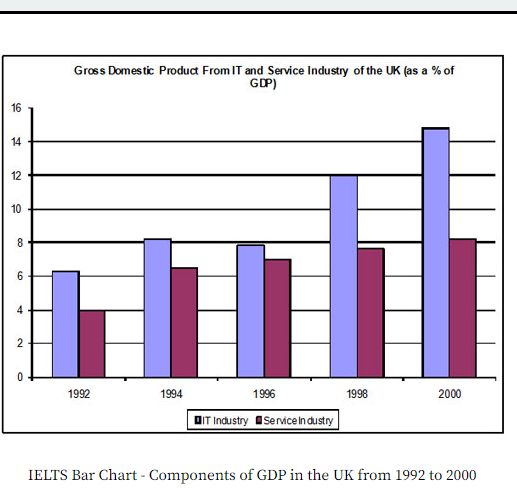
The bar graph plots the contribution of the information technology (IT) industry and service industry to the GDP in the UK in five years,1992, 1994, 1996, 1998, and 2000. The GDP share is given in percentage.
Overall, the IT industry had a larger share of the country’s GDP than the service industry in all five years. While the difference had been not significant till 1996, it was remarkable in 2000.
In detail, with a little more than 6% share in the country’s GDP in 1992, the IT sector achieved close to a 120 % increase in 2000, but the service industry, gradually increasing from a 4% share in 1992, managed to add only 4% more in 2000. While the service industry trailed behind the IT sector substantially in 1998 and 2000, it was behind the former by less than one percentage point in 1996. Nevertheless, neither of them had a dip from the previous level in all five years.
Top answer
The bar graph plots the percentage contribution of the information technology (IT) industry and service industry to the GDP in the UK in five years,1992, 1994, 1996, 1998, and 2000. The GDP share is given in percentage. Overall, the IT industry had a larger share of the country’s GDP than the service industry in all five years.
- The bar graph plots the percentage contribution of the information technology (IT) industry and service industry to the GDP in the UK in five years,1992, 1994, 1996, 1998, and 2000.
- The GDP share is given in percentage.
- Overall, the IT industry had a larger share of the country’s GDP than the service industry in all five years.
- For both sectors, the percentage increased.
- While the difference had been not significant till in 1996, it was remarkable in 2000.
Get the Weekly English Kit 📬
New words, one handy idiom, and a 2-minute quiz — delivered to your inbox to keep your streak alive.
The bar graph plots the percentage contribution of the information technology (IT) industry and service industry to the GDP in the UK in five years,1992, 1994, 1996, 1998, and 2000. The GDP share is given in percentage.
Overall, the IT industry had a larger share of the country’s GDP than the service industry in all five years.
 Related Questions