
IELTS Task 1: Dear Teacher, could you please review and give a band score to my task. Thank you so much
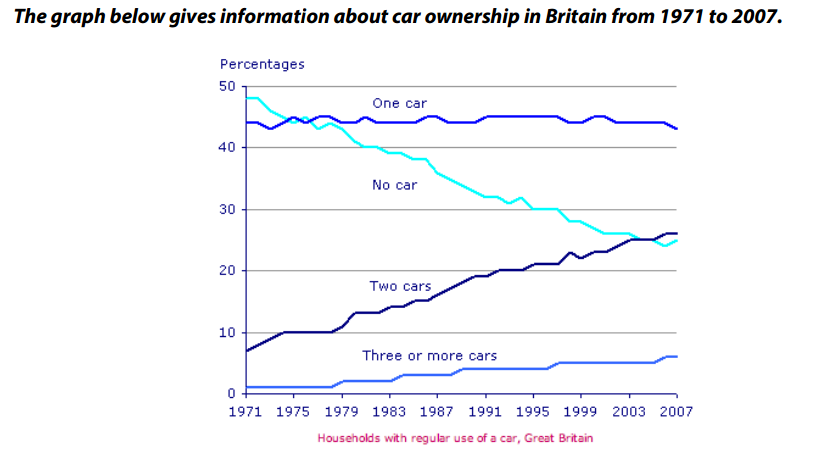
The line graph compares the proportion of the car ownership among households with permission to use of car in the UK between 1971 and 2007.
Overall a dramatical change could be witnessed in the percentages of families which possessed zero or two cars. As a reversed trend, the rate of the owners of one car or at least three cars seemed to remained plateau although the figures for households with only one car overwhelmingly outweighted the other.
In 1971 , the percentage of the households without car stood at around 50 %, with 5% higher than the figures for the ones with one car. Just below 10 % families in UK having two cars in the same year , compared with the modest figures for the category of having three or more cars .( only 2%).
By 2007, proportion of people without car considerably fell at nearly half of figure for in the beginning but 2- car users skyrocketed from 8 % to a peak of over 25% in percentage of households with car using permit in UK. There was a slight increase in the the rate of households having three or over three cars during the same period, with the figures reaching their vertex at around 7%. By contrast, the number families owning one car over the UK population kept leveling off more or less than 43%.
Top answer
The line graph compares provides the proportion percentage of the car ownership among households with permission to use of car in the UK between 1971 and 2007, based on four groups . Overal l, there were d ramat ic al chang es could be witnessed in the percenta ges of families which possessed zero or two no cars and the group which had two . As a reversed trend, In stark contrast, the rat es of the those who own ed rs of one car or and those with at least three cars seemed to remained largely unchanged plateau although the figures for households with only one car overwhelmingly outweighted outnumbered the other.
- The line graph compares provides the proportion percentage of the car ownership among households with permission to use of car in the UK between 1971 and 2007, based on four groups .
- Overal l, there were d ramat ic al chang es could be witnessed in the percenta ges of families which possessed zero or two no cars and the group which had two .
- As a reversed trend, In stark contrast, the rat es of the those who own ed rs of one car or and those with at least three cars seemed to remained largely unchanged plateau although the figures for households with only one car overwhelmingly outweighted outnumbered the other.
- In 1971 , the percentage of the households without a car stood at around 50 %, with 5% higher than the figures for the ones those with one car.
- At j ust below 1 0% were families in the UK having with two car s, in the same year , compared with the modest figu re of only 2% for the category of having households who owned three or more car s.
Get the Weekly English Kit 📬
New words, one handy idiom, and a 2-minute quiz — delivered to your inbox to keep your streak alive.
The line graph compares provides the proportion percentage of the car ownership among households with permission to use of car in the UK between 1971 and 2007, based on four groups.
Overall, there were dramatic al changes could be witnessed in the percentages o
 Related Questions