
IELTS Task 1 Check
Please help me with my essay. Thank yo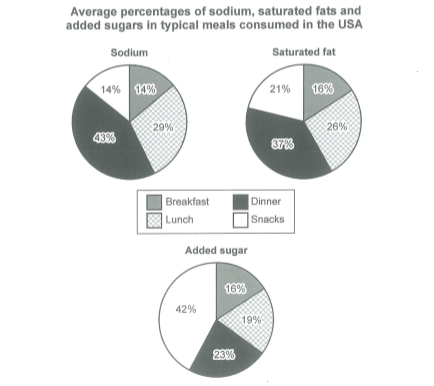
u.
The pie charts demonstrate the proportion of three types of nutrients contained in typical meals in the USA.
It can be seen that people tend to consume most sodium and saturated fat for dinner, while large amount of sugar is consumed for snacks. Added sugar is consumed with different amount during the day, compare to other nutrients.
In breakfast, saturated fat and added sugar have the same percentage at 16%, while sodium is 2% smaller. For the next meal, people consume a fair amount of sodium and saturated fat, which is 29% and 26% respectively. And 19% of added sugar is included in the same meal. Dinner contains 23% of added sugar, 37% of fat plus twice as sodium as sugar. Snacks, on the other hand, contain a minority of sodium, as well as 21% of saturated fat. However, added sugar comprises of nearly half the nutrient content in snacks.
Top answer
The pie charts demonstrate show / depict / give the proportion of three types of nutrients contained in typical meals in the USA . (That is not a correct statement. Also the paragraph is incomplete.
- The pie charts demonstrate show / depict / give the proportion of three types of nutrients contained in typical meals in the USA .
- (That is not a correct statement.
- Also the paragraph is incomplete.
- How many pie charts are there?
- What is on each one?
Get the Weekly English Kit 📬
New words, one handy idiom, and a 2-minute quiz — delivered to your inbox to keep your streak alive.
The pie charts demonstrate show / depict / give the proportion of three types of nutrients contained in typical meals in the USA. (That is not a correct statement. Also the paragraph is incomplete. How many pie charts are there? What is on each one? What are the types of nutrients? You need
 Related Questions